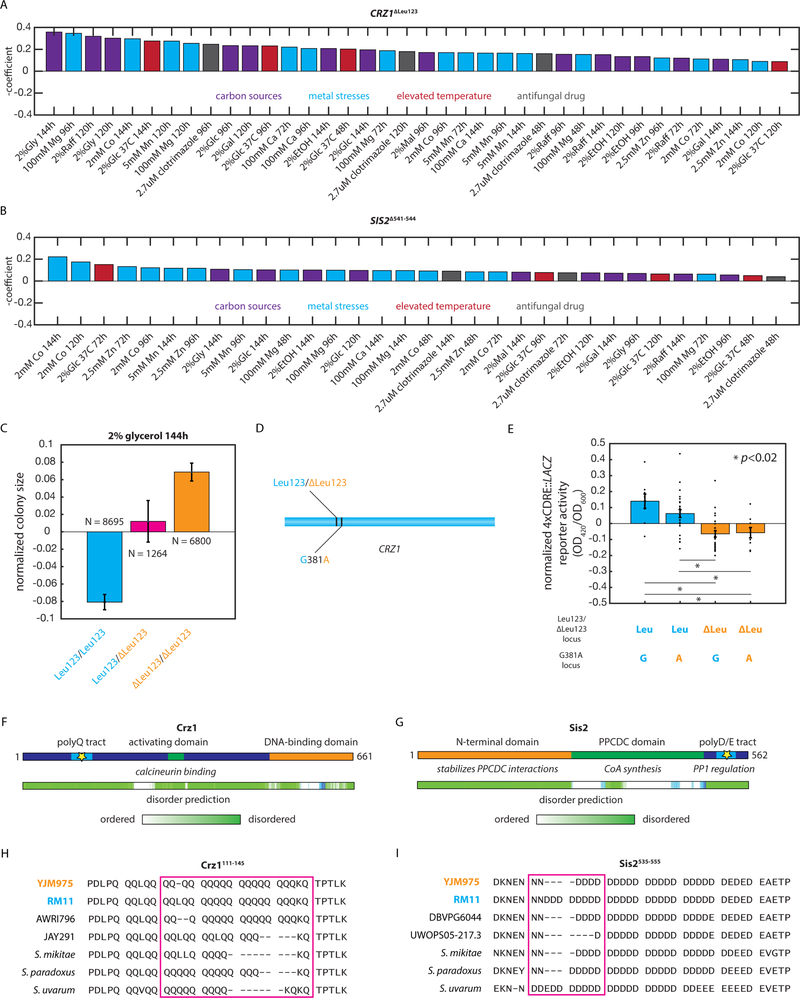
Fig. 6: Highly pleiotropic variants affect key cellular signaling hubs.
(A) Effect of the CRZ1ΔLeu123 QTN in the indicated conditions. (B) Effect of the SIS2Δ541−544 QTN in the indicated conditions. (C) Normalized colony sizes of F6 diploid progeny with the indicated genotypes after 96h of growth on media containing 2% glycerol. Error bars show s.e.m. (D) Diagram indicating the locations of the CRZ1ΔLeu123 QTN and the neighboring synonymous CRZ1381G>A variant in the CRZ1 gene. (E) Normalized 4xCDRE::LACZ reporter activity for at least N = 3 F6 haploid segregants of the indicated genotypes measured in biological triplicate. Bars show mean across the genotype; error bars show s.e.m. (F) Diagram of the Crz1 protein and predicted disorder from the Database of Disordered Protein Predictions (D2P2); the identified causal variant is indicated with a star. (G) Diagram of the Sis2 protein and predicted disorder from D2P2; the identified causal variant is indicated with a star. (H) Multiple sequence alignment of the Crz1111−145 region in the indicated S. cerevisiae strains and other yeast species. (I) Multiple sequence alignment of the Sis2516−555 region in the indicated S. cerevisiae strains and other yeast species. See also Figure S4.

