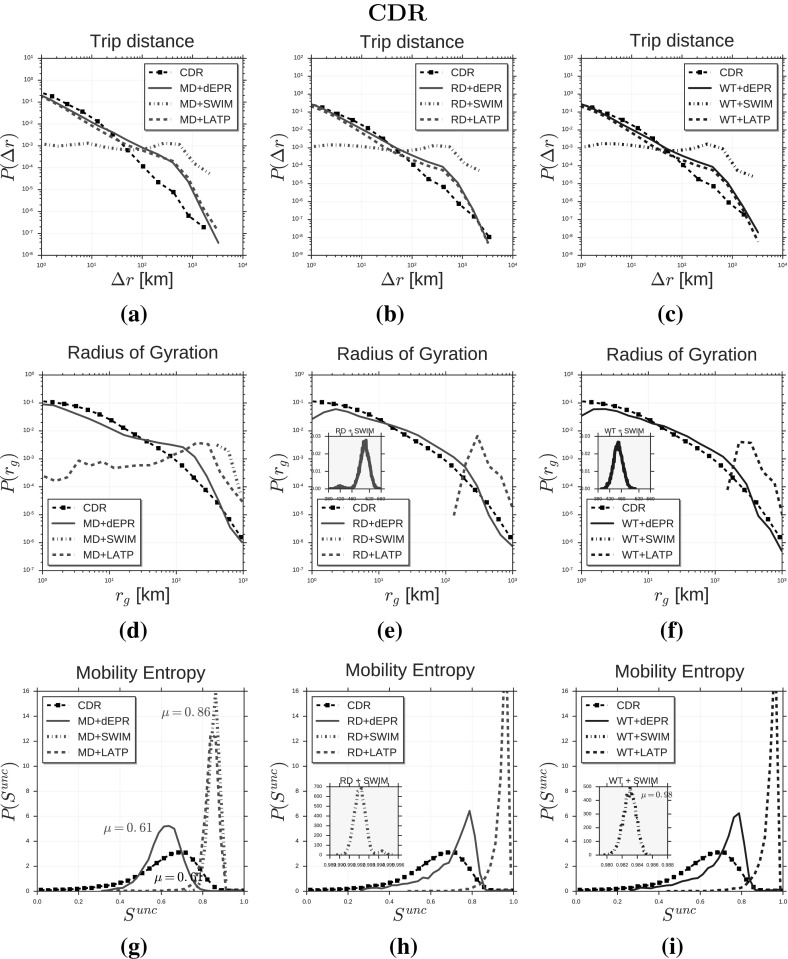
Fig. 2.
Distributions of human mobility patterns (CDR). The figure compares the models and CDR data on trip distance, radius of gyration and mobility entropy. Plots in (a–c) show the distribution of trip distances for real data (black squares) and data produced by three trajectory generators (d-EPR, SWIM and LATP) in combination with the MD generator (a), the RD generator (b) and the WT generator (c). Plots in (d–f) show the distribution of radius of gyration , while plots in (g–i) show the distribution of mobility entropy

