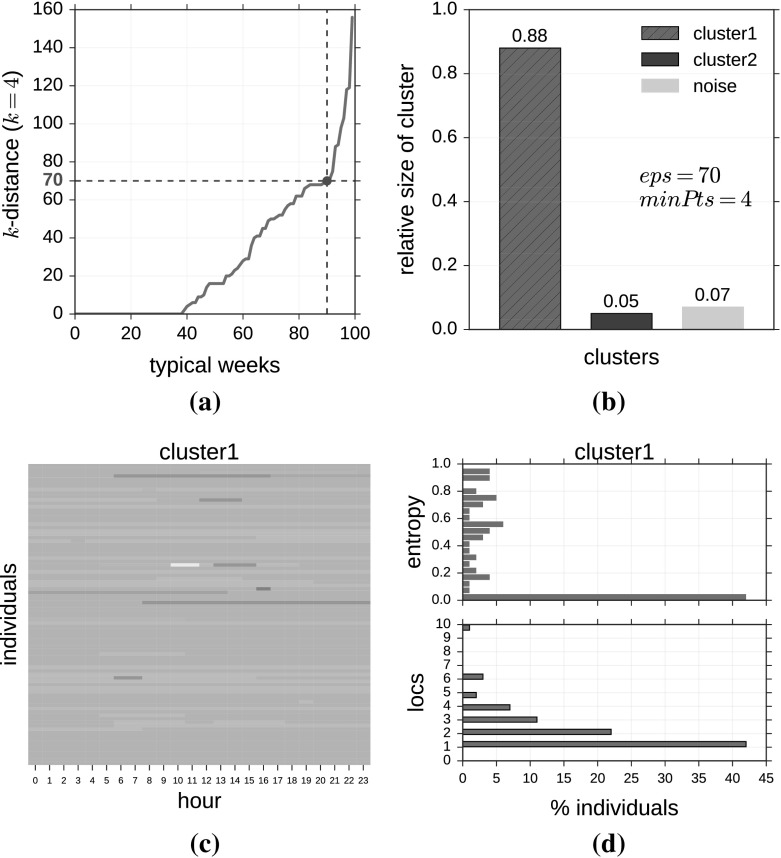
Fig. 8.
First row: a Typical weeks sorted by distance to the 4th nearest neighbor, the elbow suggests to use ; b relative size of the clusters resulting from DBSCAN algorithm with and and their relative size. Second row: c Visualization of a day of the typical weeks of 100 individuals in the GPS dataset for the first cluster. Every color represents a different abstract location in the typical diary. d Distribution of abstract location entropy and number of distinct abstract locations of time series of individuals in cluster 1

