Figure 1.

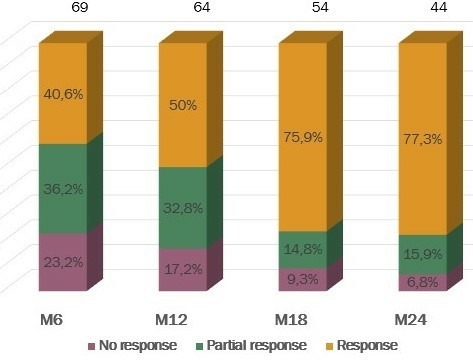
Treatment response by percentage of patients divided by three categories: no response, partial response and response. The total number of patients considered by months are presented over columns.

Treatment response by percentage of patients divided by three categories: no response, partial response and response. The total number of patients considered by months are presented over columns.