Figure 2.
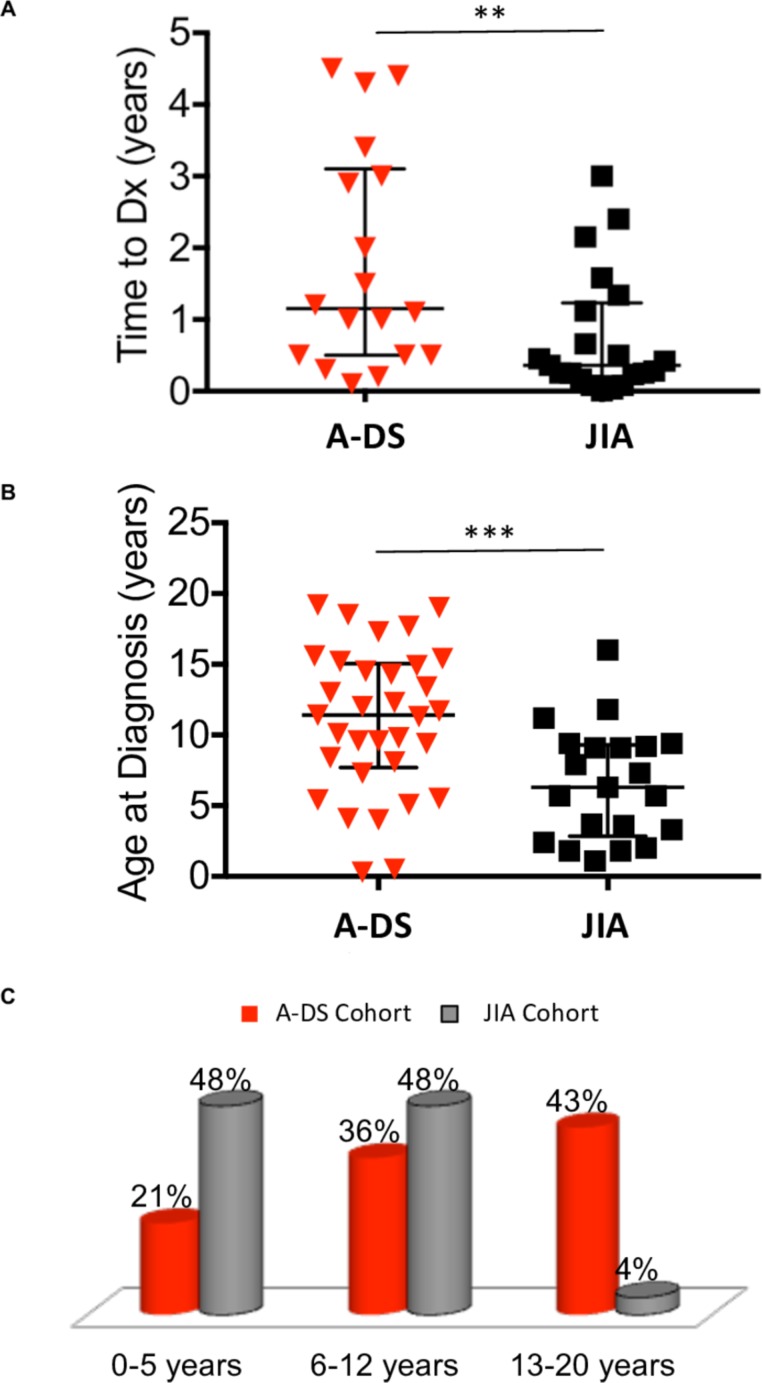
Time to diagnosis from symptom onset and age at diagnosis of A-DS and JIA. (A) The dot plot represents time to diagnosis (Dx) from symptom onset of A-DS (n=18) and JIA (n=21). Data are presented as median ± interquartile range (IQR). Average time to diagnosis for children with A-DS was significantly delayed compared to children with JIA, determined using a Mann-Whitney U test, *p<0.05, **p<0.01, ***p<0.001. (B) The dot plot represents age at diagnosis of A-DS (n=33) and JIA (n=21). Data are presented as median ± IQR. Average age at diagnosis for children with A-DS was significantly older compared to children with JIA, determined using a Mann-Whitney U test, *p<0.05, **p<0.01, ***p<0.001. (C) The bar chart represents the age distribution at diagnosis in the A-DS and JIA cohorts. Results are presented as percentage of total cohort (A-DS, n=33 and JIA, n=21). Two main peaks are observed in JIA. One in early infancy (48%) and the second in the pre-teen years (48%). In contrast, the greatest proportion of children with A-DS (43%) were diagnosed at age 13 years or above. A-DS, arthropathy of DS; JIA, juvenile idiopathic arthritis.

