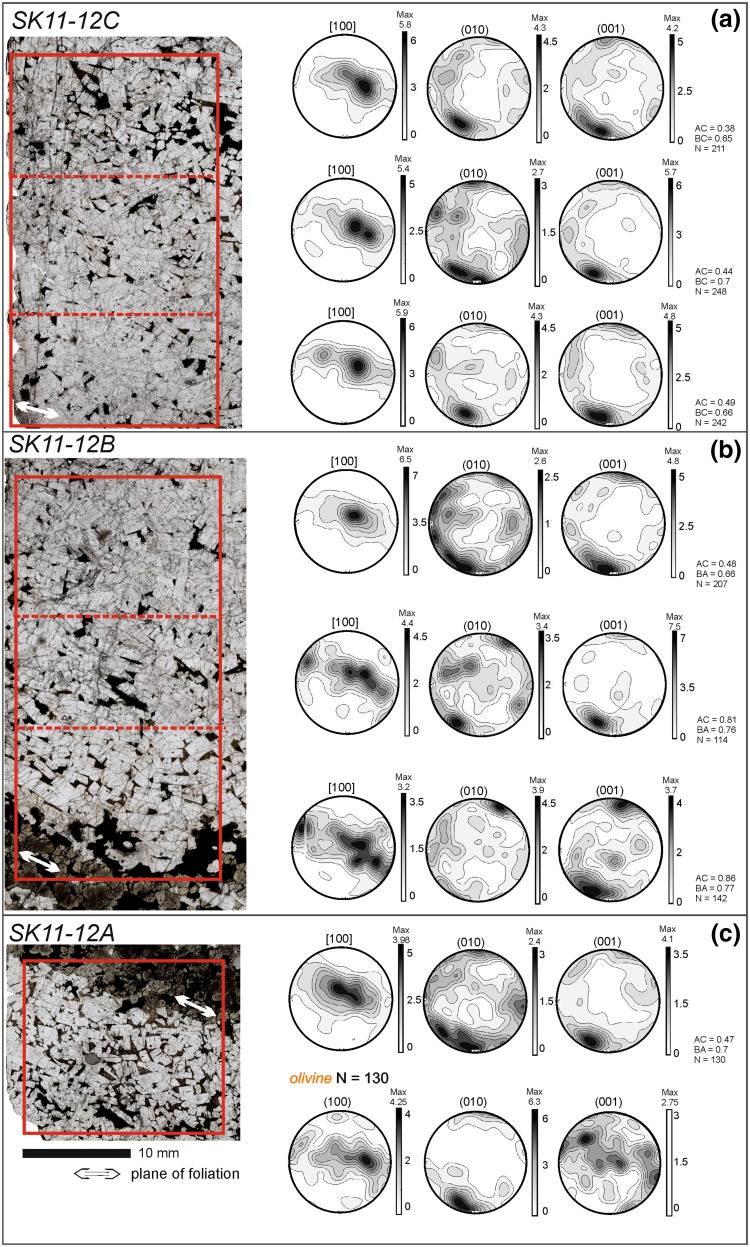
Fig. 10.
Photomicrographs of samples a SK11-12C, b SK11-12B, and c SK11-12A (Trough G), which form a continuous stratigraphy comprising three contiguous thin sections (oriented so that the younging direction is towards the top of the page). The orientation of the foliation is shown by the white double-headed arrow in each photomicrograph. Note the well-defined mafic band towards the base of the sampled stratigraphy—this marks the base of a single modally graded layer. The leucocratic portion of each thin section was subdivided to examine spatial variations in fabric strength and type (the different areas are shown by the red rectangles). The fabric in each of these areas is shown by lower hemisphere, equal-area, projections of plagioclase orientation distribution functions (ODF) calculated from one point per grain subsets

