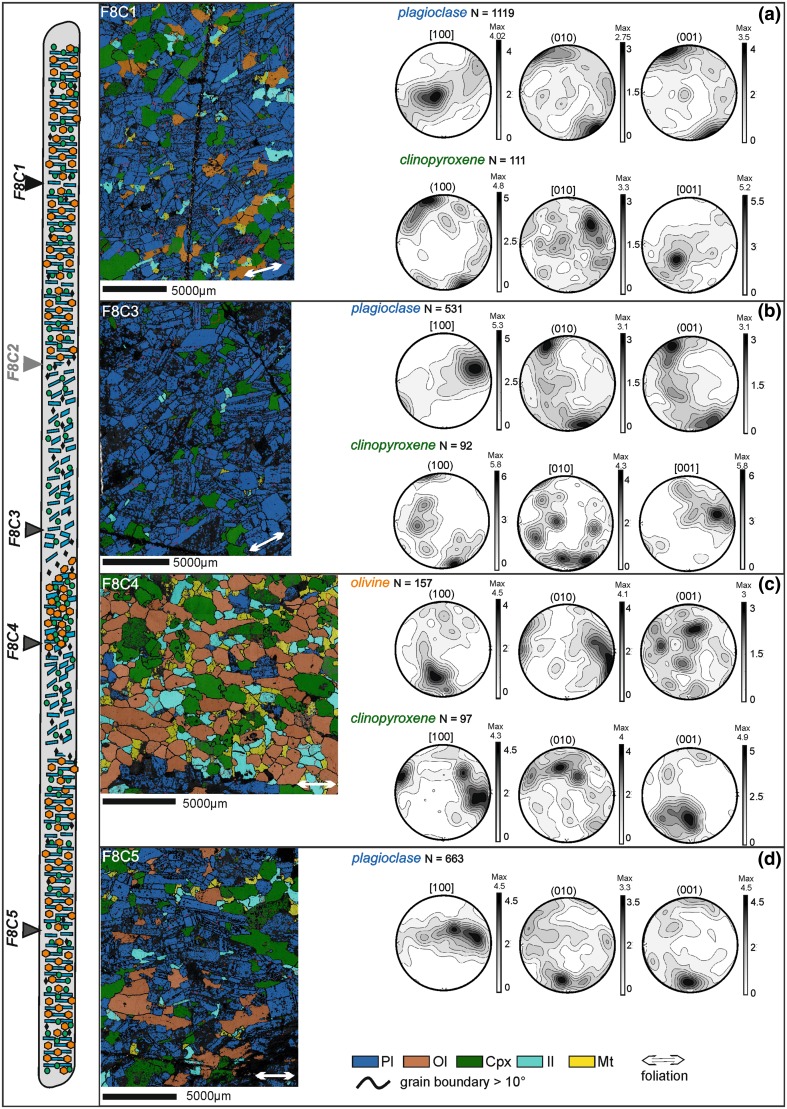
Fig. 12.
Trough F orientation data. At the extreme left of the figure is a sketch of the F8 core with arrows indicating the location of thin sections. Stratigraphic up is towards the top of the page. For each sample, the orientation and phase map is shown (with the orientation of the foliation shown by the white double-headed arrow in each phase map), together with lower hemisphere, equal-area, projections of plagioclase and clinopyroxene orientation distribution functions (ODF), each calculated from one point per grain subsets. a Sample F8C1—homogeneous gabbro. b Sample F8C2—leucocratic portion of the modally graded layer. c Sample F8C4—melanocratic portion of the modally graded layer. d Sample F8C5—homogeneous gabbro

