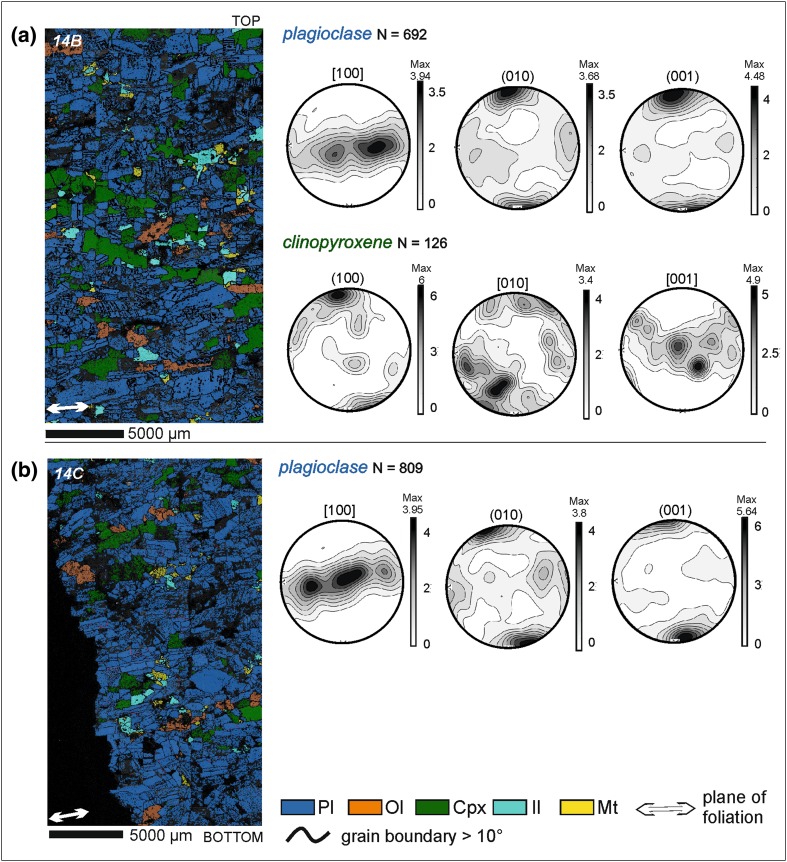
Fig. 9.
a Orientation and phase map of sample SK11-14B (Trough G) together with lower hemisphere equal-area projections of plagioclase and clinopyroxene orientation distribution functions (ODF) calculated from one point per grain subsets. b Orientation and phase map of sample SK11-14C (Trough G), together with lower hemisphere, equal-area, projections of plagioclase ODF calculated from one point per grain subsets. The orientation of the foliation is shown in each phase map by a double-headed white arrow

