
Fig. 3.
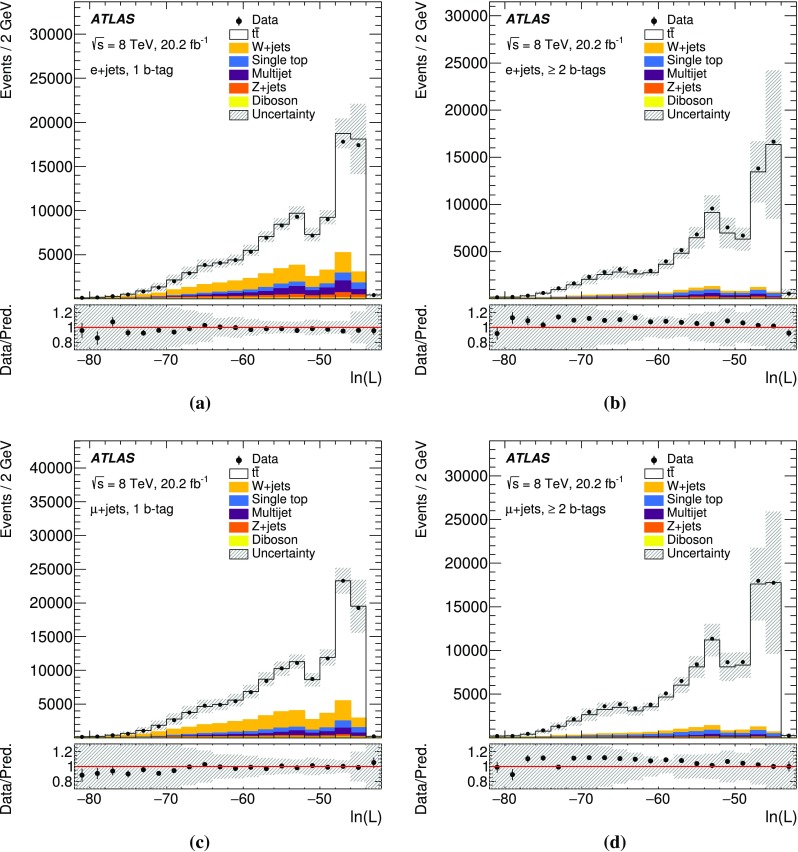
Distributions of the logarithm of the likelihood obtained from the event reconstruction algorithm for the selected a, b electron+jets and c, d muon+jets events with a, c exactly one and b, d at least two b-tagged jets. The hatched bands show the normalisation uncertainty in the signal and background contributions and the signal model systematic uncertainties. The first and last bins contain underflow and overflow events, respectively