
Fig. 5.
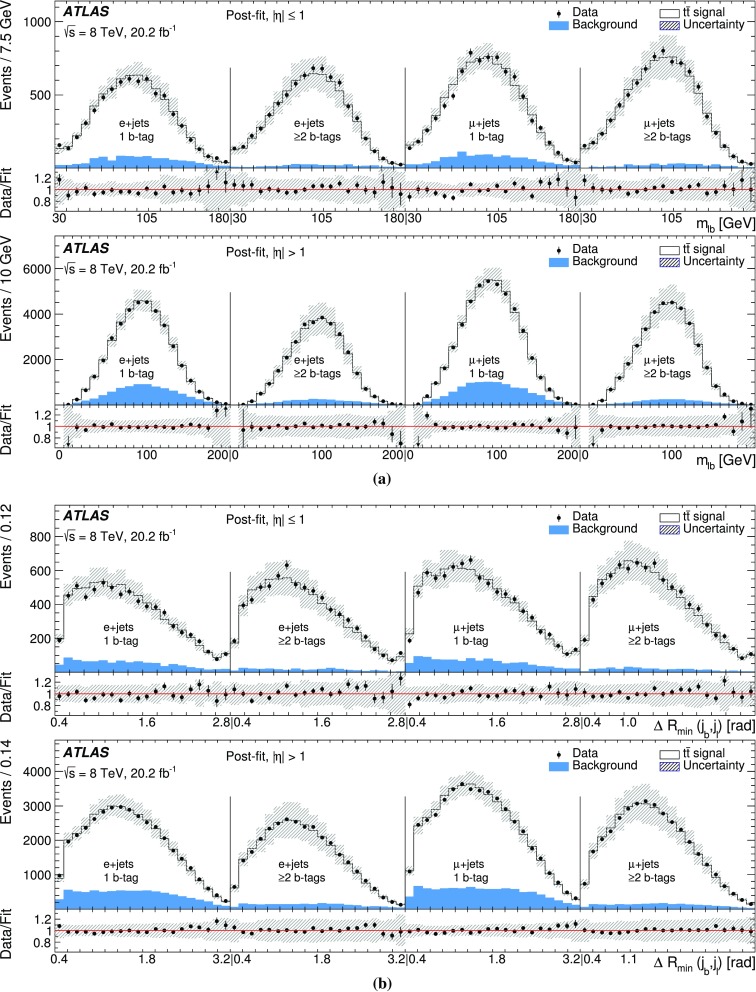
Post-fit distributions based on the best-fit templates for a and b . The background contributions are combined. The lower panel shows the ratio of data to post-fit sum of signal and background. The eight analysis regions corresponding to different b-tag multiplicity and jet pseudorapidity are shown. The vertical lines show the boundaries between the binned variables in different lepton and b-tag regions. The hatched band shows the total uncertainty. The systematic uncertainties are calculated bin-by-bin from the systematic variations by adding differences in quadrature. Then, statistical and systematic uncertainties are added in quadrature to obtain the quoted total uncertainty