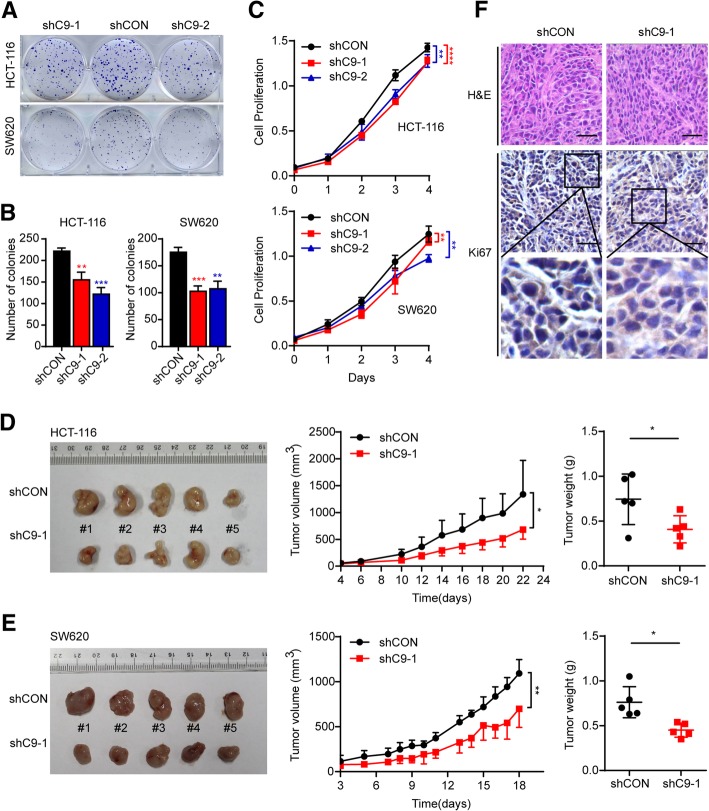
Fig. 3.
Stable knockdown of CASC9 suppresses CRC cell growth in vivo. a, b Cell growth was determined by colony-formation assay in HCT-116 and SW620 cells transduced with shCASC9 lentivirus (shC9–1 or shC9–2) or control lentivirus (shCON). a Representative graphs for colony-formation assay. b Quantification of colony numbers. c Cell proliferation of shCASC9-transduced HCT-116 and SW620 cells was determined at the indicated time points by MTS assay. d, e Subcutaneous xenografts of HCT-116 or SW620 cells infected with shC9–1 lentivirus or shCON lentivirus (n = 5). (d for HCT-116, e for SW620) Images of tumors from nude mice at autopsy are presented (left), the tumor volumes were measured at the indicated time points (middle), and the average weight of the xenografted tumors was measured (right). f Immunohistochemical staining of Ki67 in xenografted tumors of mice injected with shCASC9-HCT-116 or control cells. Scale bar, 50 μm. The data are presented as the mean ± s.d. *P < 0.05, **P < 0.01, ***P < 0.001, ****P < 0.0001 by Student’s t-test (b, d, e) or two-way ANOVA (c, d, e)

