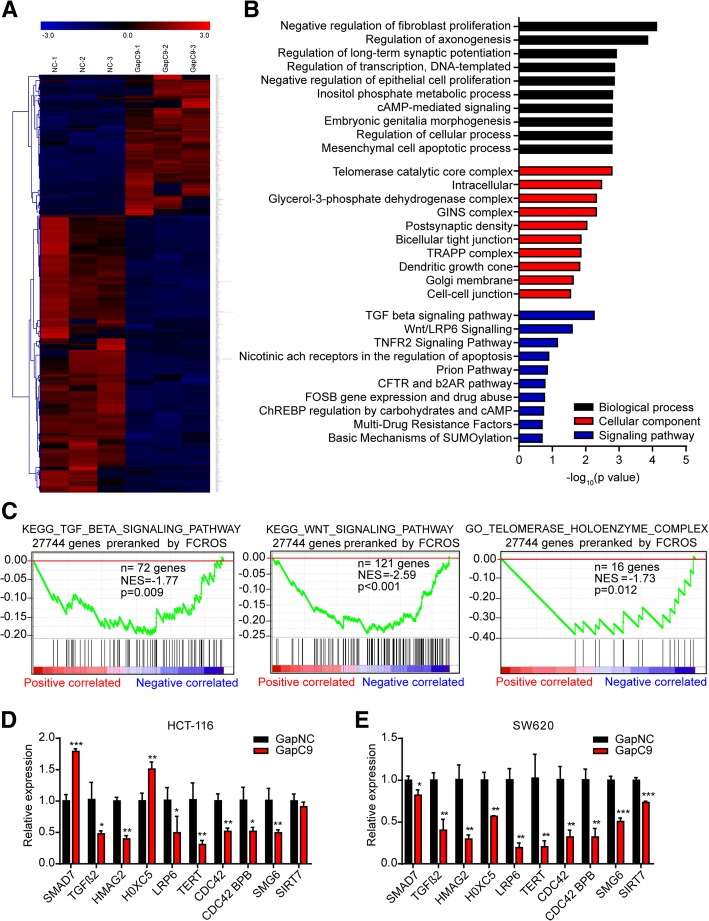
Fig. 5.
Silencing of CASC9 causes dysregulation of genes involved in cell proliferation in HCT-116 cells. a Gene expression profiles of HCT-116 cells transfected with CASC9 GapmeR (GapC9) or control GapmeR (GapNC). Genes (fold change ≥2 or ≤ 0.5, P < 0.05) are shaded in blue, black, or red in the heat map to indicate low, intermediate, or high expression, respectively. b Functional annotation clustering of genes regulated by CASC9 in HCT-116 cells is shown. The 10 most enriched groups according to GO and BioCarta analysis are ranked based on P-values. Black indicates biological process; red, cellular component; and blue, signaling pathway. c GSEA of RNA-seq data from CASC9-knockdown HCT-116 cells for TGF-β signaling pathway (left), Wnt signaling pathway (middle), and telomerase holoenzyme complex (right). NES, normalized enrichment score. d, e Genes related to the ranked pathways and tumorigenesis were verified by RT-qPCR in HCT-116 (d) and SW620 (e) cells transfected with GapC9. The data are presented as the mean ± s.d. *P < 0.05, **P < 0.01, ***P < 0.001 by Student’s t-test

