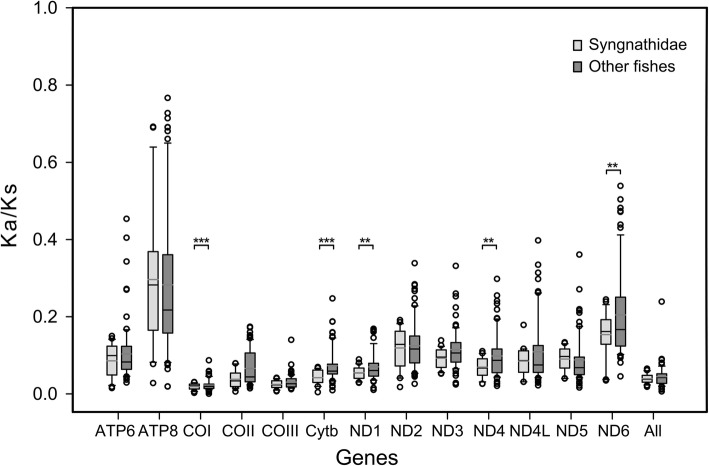
Fig. 8.
Comparison of Ka/Ks ratios for 13 individual genes and 13 gene sets between syngnathids and other fishes. “All” indicates the combined sequences of the 13 mitochondrial genes. The asterisks indicate the significance of the likelihood ratio test results from the free-ratio and one-ratio models (*, 0.01 < P < 0.05; **, 0.001 < P < 0.01; ***, P < 0.001)

