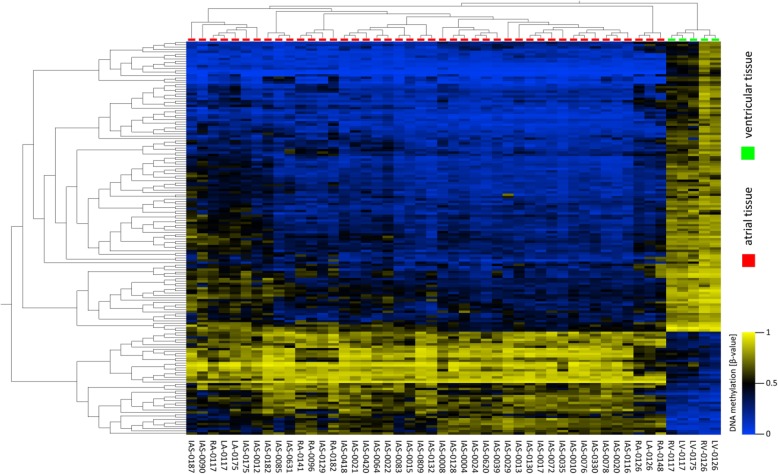
Fig. 3.
Hierarchical clustering (t test) of differentially methylated CpG loci in 49 cardiac tissue samples. One hundred and sixty-eight differentially methylated CpG loci (q ≤ 1 × 10⁻⁶ (σ/σmax > 0.4) t test) between 44 atrial (columns marked in red) and 5 ventricular heart tissue samples (columns marked in green) are depicted as hierarchical clustering analysis. Each column represents one sample (sample names and tissue types below), in case of sample 0126 and 0117 biological replicates are presented as mean values (for detailed information, see Additional file 14: Table S1). Each horizontal line represents the methylation levels of a given CpG loci across samples. Methylation levels are expressed as β-values from 0 to 1 (blue and yellow, unmethylated and completely methylated, respectively). All CpG loci show a difference of at least Δβ ≥ 0.3 (up to Δβ = 0.6) in their DNA methylation values between atrial and ventricular samples. No normalization was applied to colour code of the heat map, real β-values are shown

