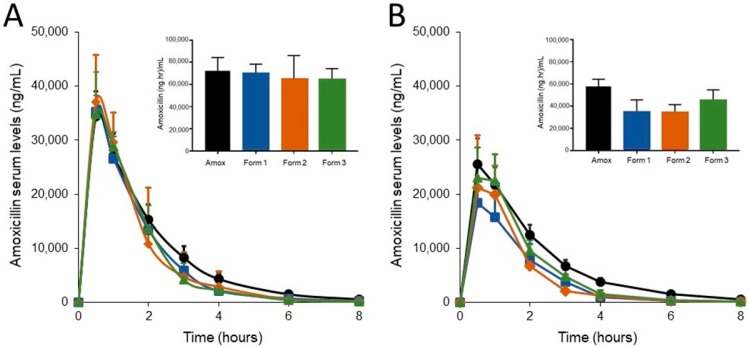
Figure 2.
Amoxicillin serum levels. Amoxicillin was measured in dog serum collected at the indicated times. (A) Amoxicillin levels after the first dose of amoxicillin (Day 1) +/- SYN-007 (Formulations 1, 2 or 3). Inset bar graph displays the area under the curve (AUC) for each group. (B) Amoxicillin levels after the last (16th) dose of amoxicillin (Day 6) +/- SYN-007. Inset bar graph displays the AUC for each group. Black, Amoxicillin alone; blue, Amoxicillin + Formulation 1, orange, Amoxicillin + Formulation 2, green, Amoxicillin + Formulation 3. Data are displayed as mean + standard deviation (n = 5). p values were obtained by analysis of the AUC from each group for each collection day using Kruskal-Wallis non-parametric ANOVA with Dunn’s multiple comparisons test (Graphpad Prism 7) comparing each group to amoxicillin alone. Day 1: Amoxicillin vs. Formulation 1, p > 0.9999, Amoxicillin vs. Formulation 2, p = 0.2925, and Amoxicillin vs. Formulation 3, p = 0.8551. Day 6: Amoxicillin vs. Formulation 1, p = 0.0083, Amoxicillin vs. Formulation 2, p = 0.0117, Amoxicillin vs. Formulation 3, p = 0.4034.

