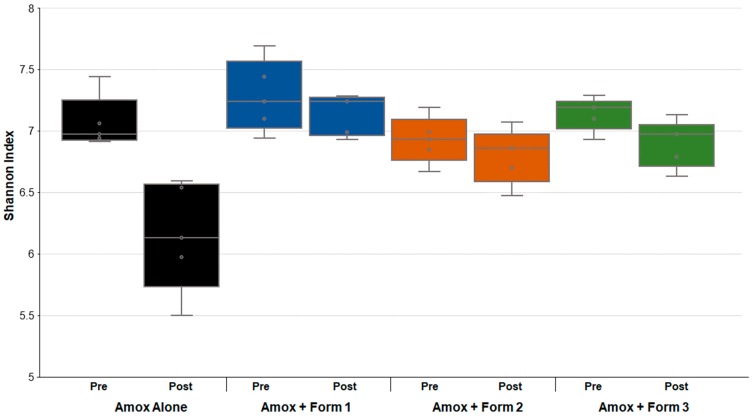
Figure 3.
Comparison of dog fecal microbiome Shannon alpha diversity prior to and after amoxicillin treatment. Fecal microbiome metagenomics data were analyzed by Shannon index and are displayed for each cohort (n = 5) as box plots. p values were obtained by comparing pretreatment Shannon indexes (Pre) to post-treatment Shannon indexes (Post) of each cohort using Kruskal-Wallis non-parametric ANOVA with Dunn’s Multiple Comparisons test (Graphpad Prism 7). Black, Amoxicillin alone, p < 0.0271; blue, Amoxicillin + SYN-007 Formulation 1, p > 0.9999; orange, Amoxicillin + SYN-007 Formulation 2, p > 0.9999; green, Amoxicillin + SYN-007 Formulation 3, p = 0.5604.

