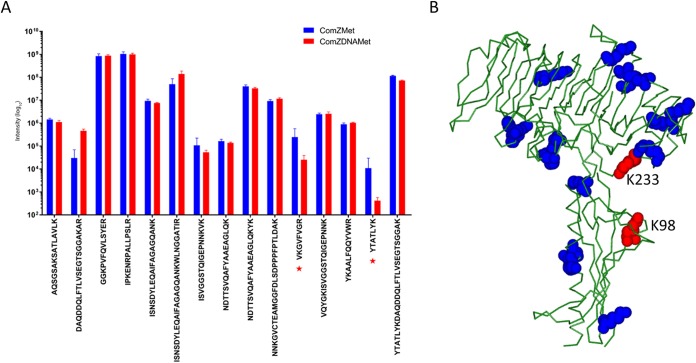
FIG 7.
LC-MS analysis of ComZ-DNA binding. (A) Intensities of dimethylated peptides in the absence (blue) and presence (red) of dsDNA (n = 3; values are ± standard errors from the means). (B) Location of lysine residues in ComZ. The two protected lysines, K98 and K233, are shown in red, and other lysines are in blue.

