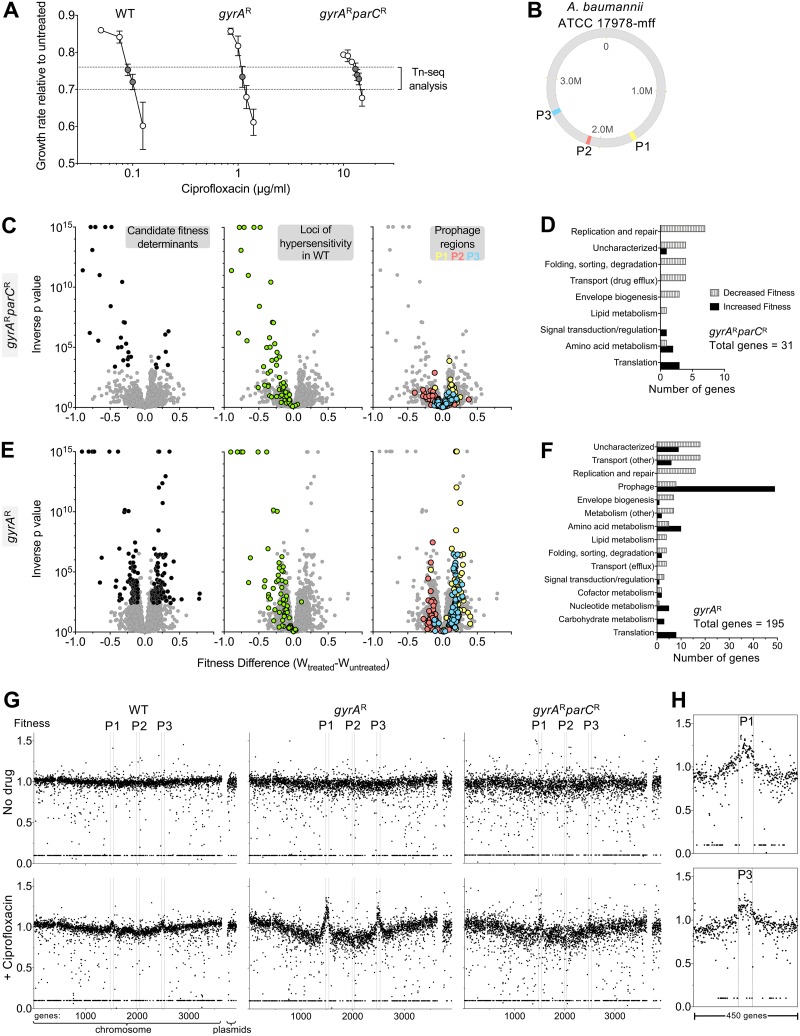
FIG 3.
Acquisition of gyrA resistance allele dramatically alters A. baumannii Tn-seq profile during ciprofloxacin challenge. (A) Transposon pools constructed in strains harboring resistance alleles in gyrA or both gyrA and parC require increasing concentrations of ciprofloxacin to result in growth inhibition. Growth rate inhibition relative to untreated pools based on bacterial density measurements was plotted as in Fig. 1A. gyrAWT parCWT mutant growth data are from an identical experiment shown in Fig. 1A and are displayed to allow comparison to behavior of drug resistant mutants. Data points show average ± SD (n ≥ 2). Samples from cultures with 25 to 30% growth inhibition (dotted lines) were processed for Tn-seq. (B) Location of prophage regions (P1 to P3) on A. baumannii 17978-mff chromosome map. Prophage positions were identified by using the PHASTER database (68). (C to F) gyrA resistance allele influences Tn-seq fitness profiles associated with ciprofloxacin stress. Mutant pools were challenged with drug concentrations that resulted in equivalent 25 to 30% growth inhibition (gyrAr mutant, 1.1 μg/ml; gyrAr parCr mutant, 13 to 14 μg/ml). (C and E) Tn-seq fitness scores for each chromosomal gene with the indicated strain were calculated and visualized as in Fig. 1B (left). Middle and right graphs show the identical data set, with highlighting of loci for which knockout causes ciprofloxacin hypersensitization in the WT genetic background (green), or loci within prophages (color indicated in key). (D and F) Gene hits associated with significant changes in fitness during treatment were placed into functional categories as in Fig. 1C. (F) Tn-seq hits resulting from gyrAr mutant libraries treated with ciprofloxacin are enriched in prophage genes. (G) Tn-seq fitness scores resulting from ciprofloxacin challenge show genome positional bias that is greatly amplified in gyrAr mutant pools. Average per-gene Tn-seq fitness values are plotted in order of gene position on the chromosome or on plasmids pAB1 to pAB3. Boundaries of prophage regions (P1 to P3) are indicated by vertical dotted lines. Top, no-drug control. Bottom, ciprofloxacin was added at the concentrations indicated in panel A (WT, 0.09 to 0.1 μg/ml; gyrAr mutant, 1.1 μg/ml; gyrAr parCr mutant, 13 to 14 μg/ml). (H) Expanded view of per-gene Tn-seq fitness scores in regions surrounding prophages P1 and P3 for gyrAr mutant treated with 1.1 μg/ml ciprofloxacin.

