FIG 5.
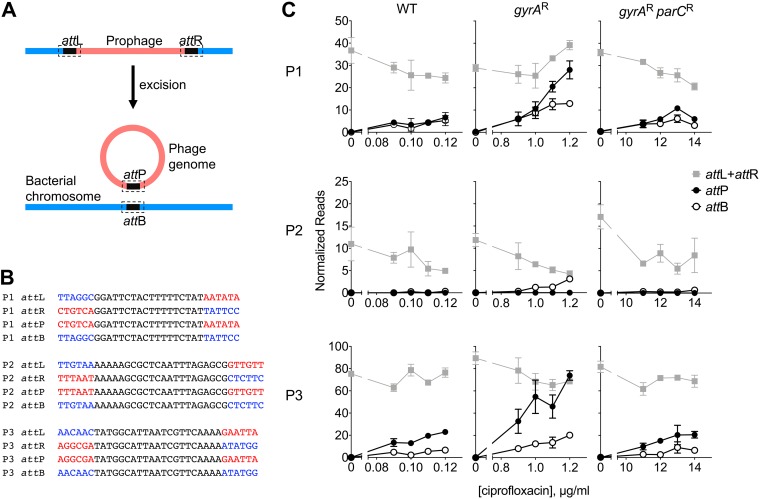
Enhanced frequency of prophage excision and circularization in gyrAr single mutant. (A) Diagram of prophage excision at attachment sites (att; indicated by dashed boxes) showing generation of attP and attB sites after excision. (B) Prophage core att sequences (black) were determined using PHASTER database and BLAST analysis. Six-base-arm sequences flanking the core att sites were used to define attL, attR, attP, and attB. Prophage-specific DNA is shown in red, and chromosome-specific DNA is shown in blue. (C) Illumina whole-genome sequencing reads from experiment shown in Fig. 4 and an additional independent experiment were searched using the sequences shown in panel B. Read counts were normalized against total library size and displayed as counts per 10 million reads. Data points show average of normalized read count ± range (n = 2).

