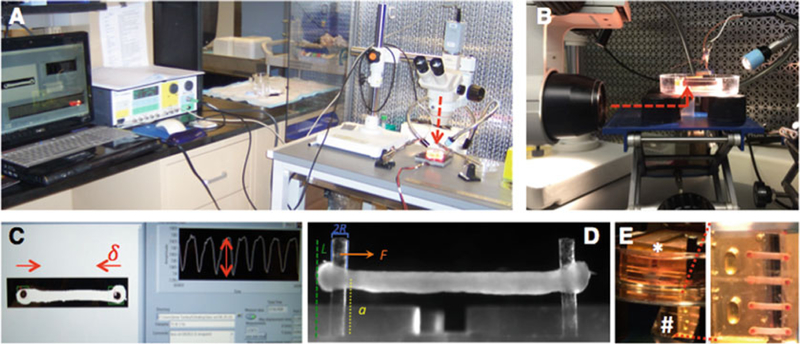
Fig. 2.
Overview of hECT data acquisition. (a) Set up for data acquisition from hECT on single-tissue bioreactor. Camera viewing path (dotted red line) aligned with top view of hECT. (b) Set up for data acquisition from hECT multitissue bioreactor. Camera viewing path (dotted red line) aligned with mirror. (c) Screen view during data acquisition, live tracking of inward post-displacement during hECT contraction (δ), with corresponding measurement of the amplitude of each contraction (double headed arrow). (d) Side view of hECT on single- tissue bioreactor with embedded schematic of the measurements included in the calculation of force. (e) Multitissue bioreactor (*) with tissues submerged facing the bottom of the dish, and reflected image of hECT on mirror (#) to allow for imaging and data collection without manipulation of the hECT

