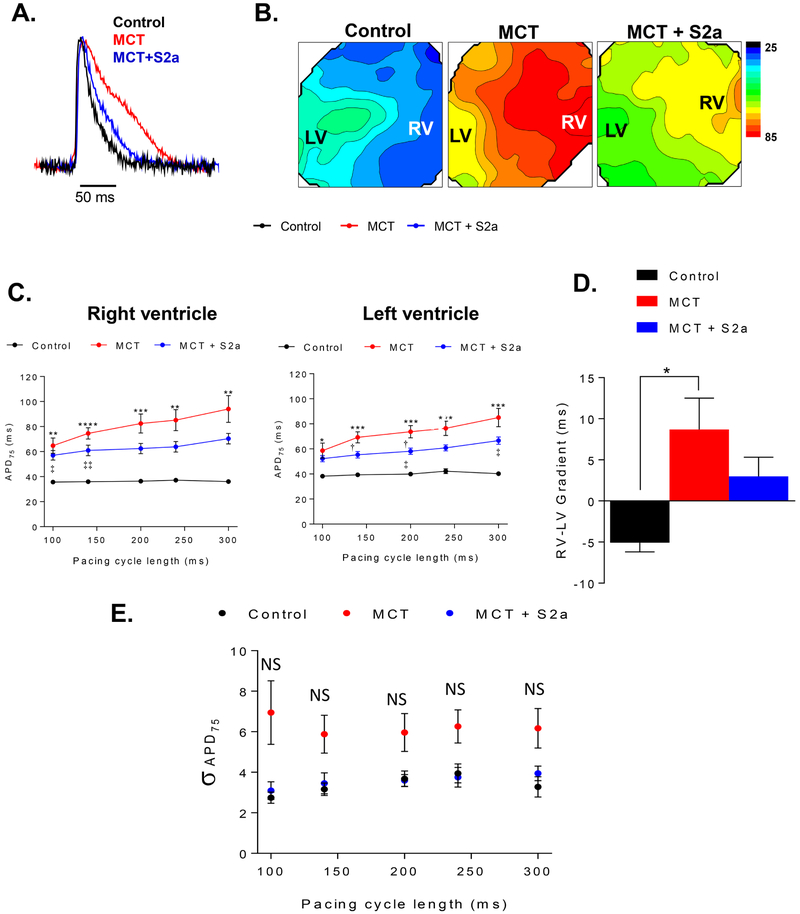
Figure 2. Action potential remodeling in untreated and S2a-treated MCT hearts relative to control.
A. Superimposed AP traces from representative CTRL (black), MCT (red), and MCT+S2a (blue) treated hearts during baseline steady-state pacing. Average epicardial APD measured at 75% of repolarization (APD75) in CTRL (black), MCT (red), and MCT+S2a (blue).B. Contour maps representing APD75 across the anterior epicardial surface. C. Average RV and LV APD75 in CTRL (black), MCT (red), and MCT+S2a (blue). D. Average APD75 gradient from the RV to the LV. N =4 CTRL, 9 MCT, and 5 MCT+S2a. APD = action potential duration; APD75 = APD measured at 75% repolarization; PCL = pacing cycle length. E. APD heterogeneity indexed by the standard deviation of APD75 values measured across all pixels in CTRL (black), MCT (red), and MCT+S2a (blue). N=4 control, 9 MCT, and 5 MCT+S2a. *P <0.05, **P <0.005, ***P <0.0005, ****P <0.0001 by one-way ANOVA and Tukey post-test. † P MCT vs MCT+S2a <0.05, †† P MCT vs MCT+S2a <0.005. ‡ P MCT+S2a vs CTRL <0.05, ‡‡ P MCT+S2a vs CTRL <0.005.

