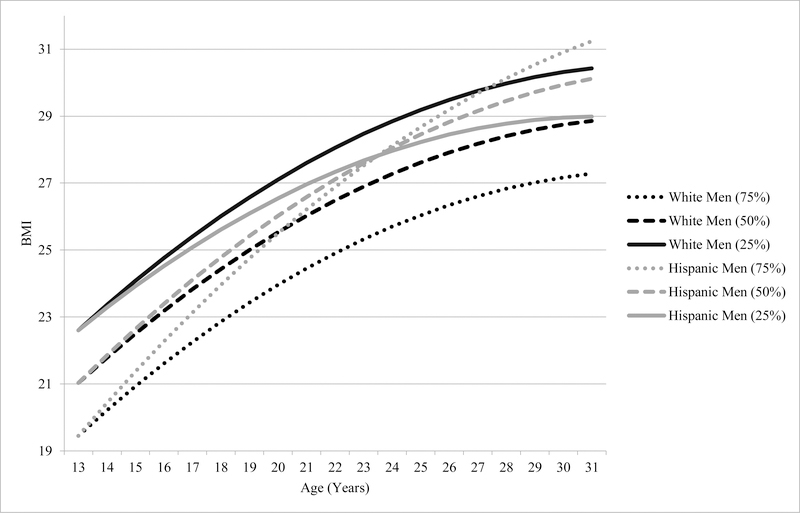
Figure 2. Age-trajectories of BMI by Race-ethnicity and Parental Wealth among Men, National Longitudinal Survey of Youth 1997 Cohort, Waves 1–15 (N = 3, 711).
Note: Figure 2 is based on Model 3 in Table 3. 25% indicates individuals at the 25th percentile of the parental wealth distribution, and 50% and 75% represent those at the 50th and 75th percentile, respectively. For the sake of concision, only trajectories for white and Hispanic men are displayed. Results indicated that parental wealth similarly affected BMI trajectories for white and black men.

