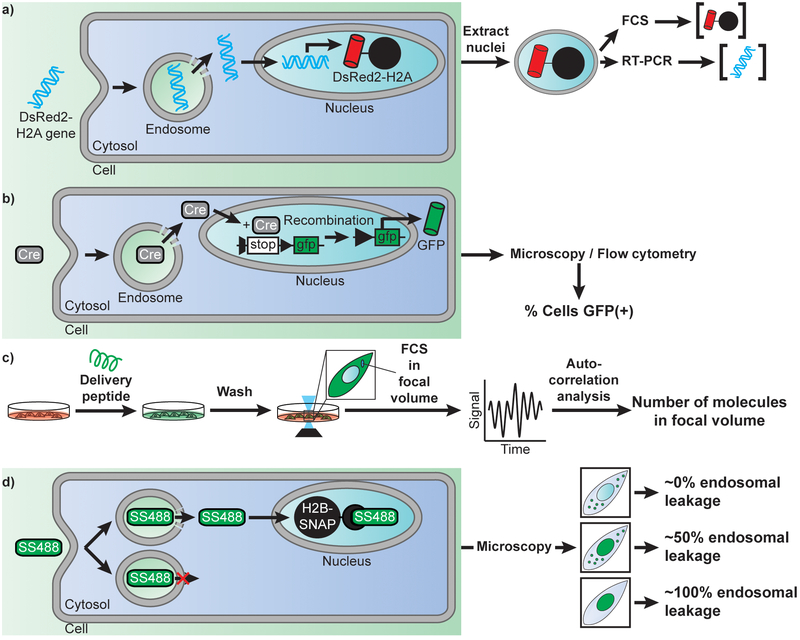
Figure 2.
Examples of approaches used to detect the efficiency of cellular delivery and of endosomal escape. A) Measuring the efficiency of DNA nuclear delivery by using a DsRed2-H2A reporter. Once endocytosed, a plasmid encoding the histone H2A labeled with the fluorescent protein DsRed, escapes endosome, penetrate the cytosol, and translocate into the nucleus. Expression of the delivered plasmid leads to a fluorescent DsRed signal sequestered in the nuclei of cells by incorporation of H2A into chromatin. Nuclei are extracted and analyzed by flow cytometry to establish protein expression level. Nuclei of various intensities are then sorted, and their plasmid content is quantified by real-time PCR. This analysis can therefore reveal how many plasmids entered the nucleus of cells for a given transfection reagent and relate delivery efficiency to gene expression outcomes. B) Measuring the efficiency of enzyme delivery by using the Cre recombinase as a model. Cells transfected with a GFP gene under a loxP split promoter are treated with Cre recombinase and a delivery agent. Upon successful delivery of Cre recombinase, the split promoter is recombined allowing downstream expression of GFP. Cells are then scored for delivery based on the presence or absence of cytosolic GFP fluorescence. C) Quantitative measurement of the concentration of a peptide or protein delivered into the cytosol of cells. Cells are treated with a fluorescently labeled cell-penetrating species. Cells are then washed to remove all traces of fluorescent signal outside cells and imaged by confocal microscopy. A focal volume within the cytoplasmic area of a cell is chosen and Fluorescence Correlation Spectroscopy is performed. Autocorrelation analysis is performed, and the y-intercept of the autocorrelative curve generated is used to determine the cytosolic concentration of fluorescent molecules (76). D) Quantitative determination of how leaky endosomes are upon treatment with a delivery agent. Cells are transfected with a gene encoding a fusion construct of the histone H2B labeled with a SNAP-tag. Cells are then treated with the delivery agent and the cell-impermeable fluorophore SNAP-Surface 488 (SS488). Depending on the efficiency of the delivery agent and of its membrane disruption activity, endocytosed SS488 is either entrapped in the endosome or released in the cytosol of cells. Once in the cytosol, SS488 is sequestered to the nucleus via an irreversible reaction with the SNAP-tag. As a result, the fluorescence of SS488 is either punctate (trapped inside endosomes), or nuclear (bond to SNAP-H2B). More specifically, the nuclear capture depletes the cytosolic signal, thereby revealing more clearly the signal left inside endosomes. In turn, this approach can be used to estimate the efficiency of endosomal leakage, that is, how much signal is in the nucleus vs how much is left trapped inside endosomes.

