
Figure 12.
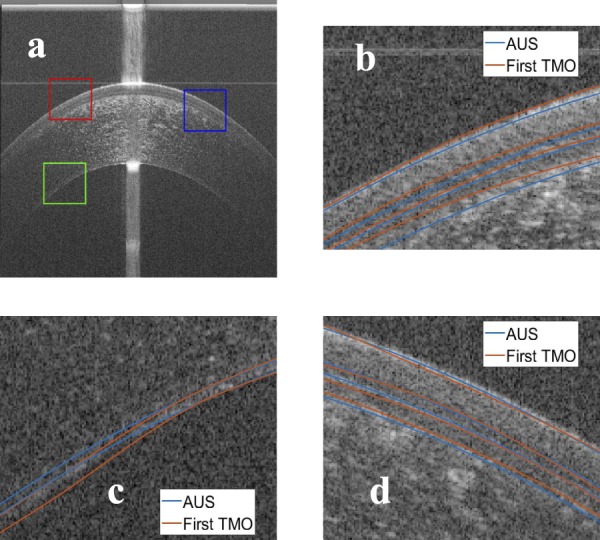
Comparison between the manual segmentation of the first operator (red) and the automatic segmentation (blue) using an averaged OCT image. (a) The compared regions highlighted on the OCT image, (b) red window at the epithelium-air interface, (c) green window at the EN, and (d) blue window at the epithelium-air interface.