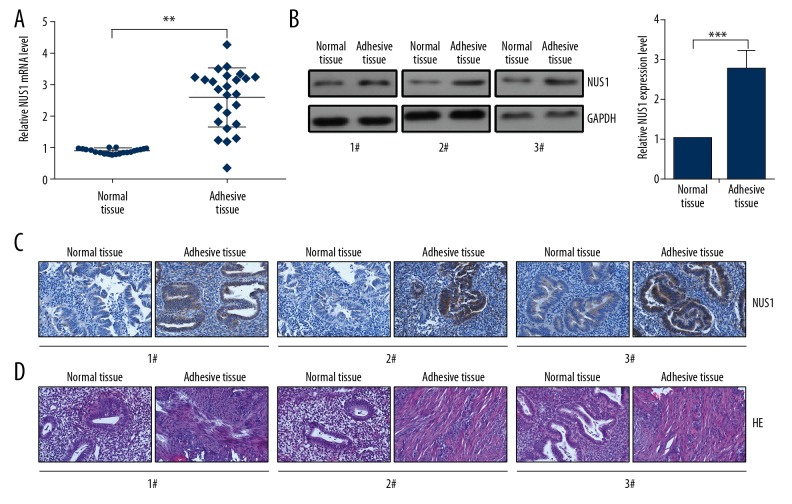
Figure 1.
NUS1 was upregulated in IUAs tissues. (A) The mRNA levels of NUS1 in normal tissues and IUAs (n=25) tissues were evaluated by RT-qPCR assay. (B) Protein levels of NUS1 in normal tissues and IUAs (n=25) tissues were evaluated by Western blot assay. (C) The expression of NUS1 in normal tissues and IUAs (n=25) tissues were evaluated by IHC staining. (D) HE staining showed the abnormal morphology in IUAs tissues. Results are presented as the mean ±S.D from 3 independent experiments. ** P<0.01, and *** P<0.001.

