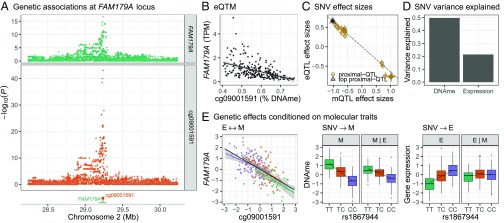
Fig. 2.
FAM179A-cg09001591 causal analysis. (A, Top) SNV association with cg09001591 (orange) or FAM179A (green). (A, Bottom facet) cg09001591 DNAme site (orange lollipop) and FAM179A gene body (green line). (B) Scatter plot of cg09001591percentage DNAme (x axis) and FAM179A transcripts per million (TPM; y axis). (C) Scatter plot of mQTL effect sizes with SEs (x axis) by eQTL effect sizes with SEs (y axis) for SNVs used in the HEIDI test. The black dashed line is the estimated MR effect based on the top QTL SNV (black triangle). (D) Percent DNAme and gene expression variance explained (y axis) by rs1867944 genotypes. (E) Scatter plot of residual cg09001591 DNAme (adjusted for PEER factors used in eQTM mapping; x axis) and residual FAM179A gene expression (adjusted for PEER factors; y axis). Linear regression line for eQTM association overall (black) and colored by the rs1867944 genotype (TT, green; TC orange; CC, purple; Left). Box plots and linear regression line (additive model) of residual cg09001591 DNAme by rs1867944 genotype (facet M). Box plot and regression line as for M, except with adjustment of residual cg09001591 DNAme by residual FAM179A gene expression (facet M|E). Box plots and linear regression line (additive model) of residual FAM179A gene expression by rs1867944 genotype (facet E). Box plot and regression line as for E except with adjustment of residual FAM179A gene expression by residual cg09001591 DNAme (facet E|M).

