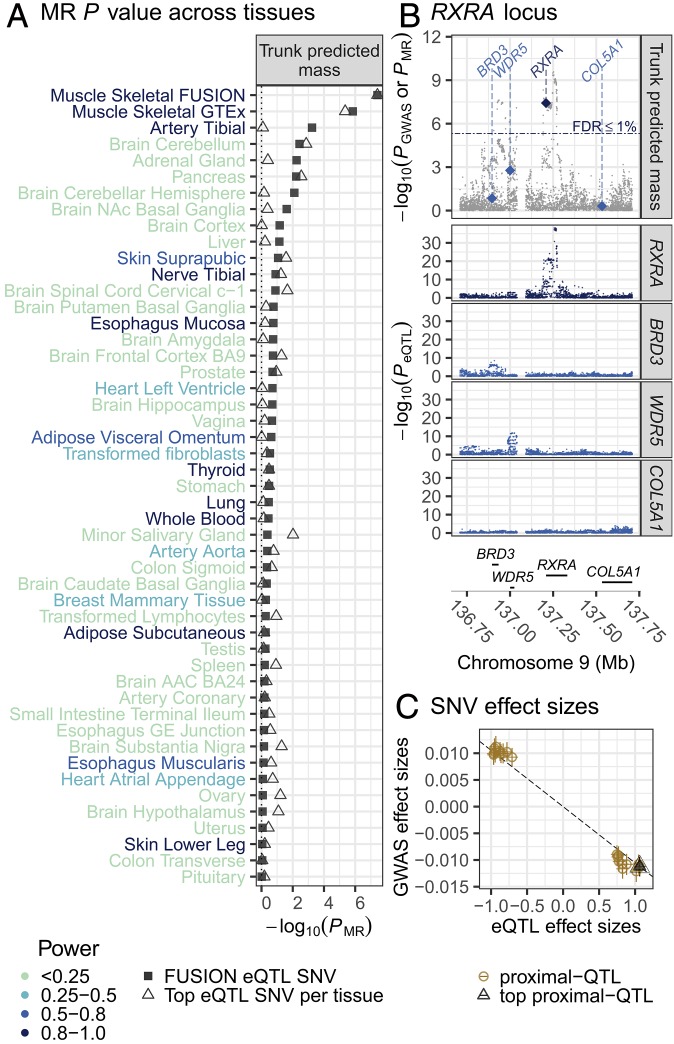
Fig. 3.
MR association of UK Biobank GWAS of trunk predicted mass and RXRA-eQTL results in FUSION skeletal muscle and GTEx tissues. (A) MR association (x axis) for UK Biobank trunk predicted mass with the top RXRA-eQTL SNV from FUSION (rs6583658; square) or the top GTEx tissue-specific RXRA-eQTL SNV (triangle) across FUSION skeletal muscle and GTEx tissues (y axis). Power to detect an RXRA MR association (color of tissue name; Methods). ACC, anterior cingulate cortex; GE, gastroesophageal, NAc, nucleus accumbens basal. (B, Top) UK Biobank trunk predicted mass–SNV association (gray points); MR association P values for RXRA (dark blue diamond) and nearby, protein-coding genes (light blue diamond; diamonds drawn at the TSS of the gene). (Middle) FUSION SNV-gene expression association results for RXRA and other nearby genes. (Bottom) Genes in the region. (C) Scatter plot of FUSION RXRA-eQTL effect sizes and SEs (x axis) and trunk predicted mass GWAS effect sizes and SEs (y axis) for SNVs used in the HEIDI test. The black dashed line is the estimated MR effect based on the top QTL SNV (black triangle).

