Fig. 1.
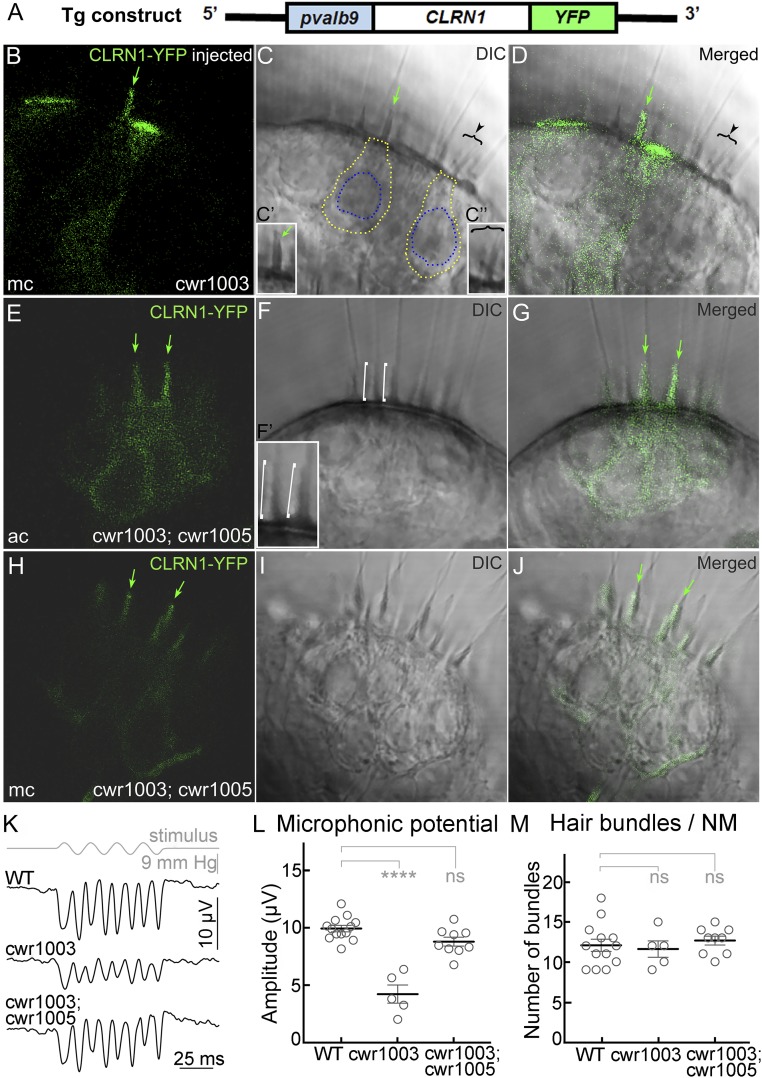
CLRN1 restores hair bundle structure and function in cwr1003 hair cells. (A) Schematic representation of the DNA construct used to generate the cwr1003; cwr1005 transgenic line; pvalb9, promoter sequence from the zebrafish parvalbumin 9 gene. (B–D) Cone-shaped hair bundle morphology (green arrow) observed in hair cells of the medial crista (mc) expressing CLRN1-YFP, and split or splayed hair bundle morphology observed in adjacent YFP-negative hair cells (arrowhead and bracket), as revealed by the DIC (C) and merged (D) images. The marked bundles are enlarged in the Insets (C′ and C″). (E–J) The hair bundle morphology is uniformly cone-shaped (similar to WT) in all hair cells in the anterior crista (ac) and medial crista (mc) of cwr1003; cwr1005 larvae, which express CLRN1-YFP. DIC images reveal cone-shaped bundles across both cristae (F and I), and merged images (G and J) confirm colocalization of the YFP signal and cone-shaped bundles. The green arrows in B–E, G, H, and J point to cone-shaped or rescued bundle morphology in CLRN1-YFP–expressing hair cells; white brackets in the DIC image (F) point to two representative cone-shaped bundles enlarged in the Inset (F′). (Magnification: 63×.) (B–J) The 1-µm middle (optical) section images of the crista captured from live larvae at 6 dpf. (K–M) Microphonic potentials recorded from the neuromast (NM) hair cells of cwr1003; cwr1005, and control siblings. (K) Representative traces of microphonic potentials recorded from different genotypes, and stimulus are shown. The top trace shows pressure applied to the stimulating puff pipette. (L) Summary of the microphonic potential peak-to-peak amplitudes at twice the stimulus frequency. Average values of microphonic potentials obtained from the lateral line neuromasts of WT, cwr1003, and cwr1003; cwr1005 larvae at 6 dpf. (M) Number of hair bundles per neuromast from WT, cwr1003, and cwr1003; cwr1005 larvae. Analysis of the same larvae is shown in L and M (n = 13 in WT; n = 5 in cwr1003; and n = 9 in cwr1003; cwr1005 groups). Data shown in L and M represent the mean ± SEM. Asterisks indicate statistical significance, and “ns” indicates nonsignificance, one-way ANOVA with Tukey’s multiple-comparisons test: ns, P > 0.05; ****P < 0.0001.

