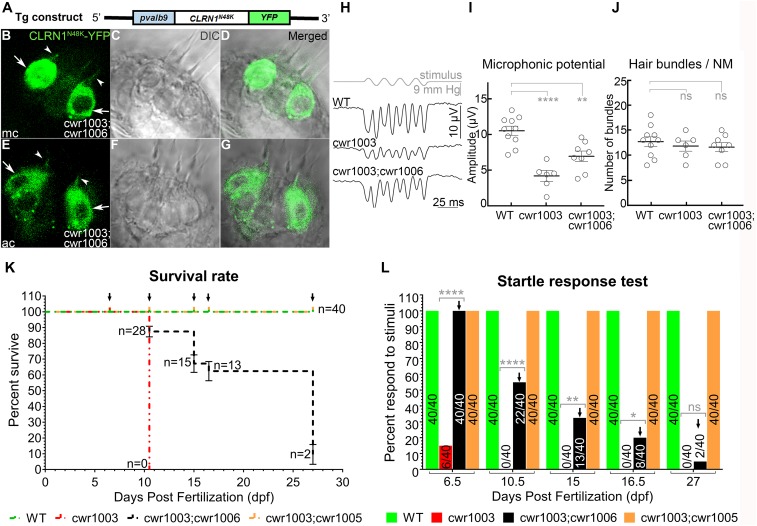
Fig. 2.
Progressive loss of hair cell function in cwr1003 larvae expressing CLRN1N48K. (A) Schematic representation of the DNA construct used to generate the cwr1003; cwr1006 transgenic line. (B–G) Representative images of hair cells from the medial crista (mc) (B) and anterior crista (ac) (E). The majority of CLRN1N48K expressed in the cwr1003 hair cells was mistargeted (arrows, B and E), and relatively small amounts reached the hair bundle (arrowhead, B and E) The bundle morphology in cwr1003; cwr1006 larvae was cone shaped. Merged images of YFP and DIC panels reveal that the YFP signal coincides with the cone-shaped bundle morphology. The DIC image of the corresponding crista in C, D, F, and G indicates the presence of CLRN1N48K in the bundle rescue cwr1003 larvae hair bundle phenotype. Images captured from live larvae at 6 dpf. Images shown are single plane (optical section) images and are 1-µm middle section of the crista. (Magnification: 63×.) (H–J) Microphonic potentials from hair cells of the neuromast from cwr1003; cwr1006 larvae reveals that CLRN1N48K expression improves mechanosensory function of cwr1003 larvae bundles but fails to reach WT levels. (H) Representative traces of microphonic potentials recorded from WT, cwr1003, and cwr1003; cwr1006 larvae are shown here. The top trace shows pressure applied to the stimulating puff pipette. (I) Summary of microphonic potential peak-to-peak amplitudes at twice the stimulus frequency. Average values of microphonic potentials obtained from lateral line neuromasts of zebrafish larvae from the following genotypes, WT (n = 10), cwr1003 (n = 6), and cwr1003; cwr1006 (n = 8), at 6–7 dpf. (J) The number of hair cells per neuromast were quantified in the same WT, cwr1003, and cwr1003; cwr1006 larvae used to analyze microphonic potential amplitudes. (K) Quantification of the cwr1003; cwr1006 zebrafish survival rate in comparison with cwr1003 zebrafish using the Kaplan–Meier survival analysis. (L) Number of larvae that displayed startle response diminished over time, and it coincided with the number of larvae that survived, indicative of a close relationship between hair cell function and survival, and variable-onset progressive loss of hair cell function in cwr1003; cwr1006 larvae. Data in I and J represent the mean ± SEM. Asterisks indicate statistical significance, and “ns” indicates nonsignificance, one-way ANOVA with Tukey’s multiple-comparisons test: ns, P > 0.05; *P ≤ 0.05; **P < 0.01; ****P < 0.0001.

