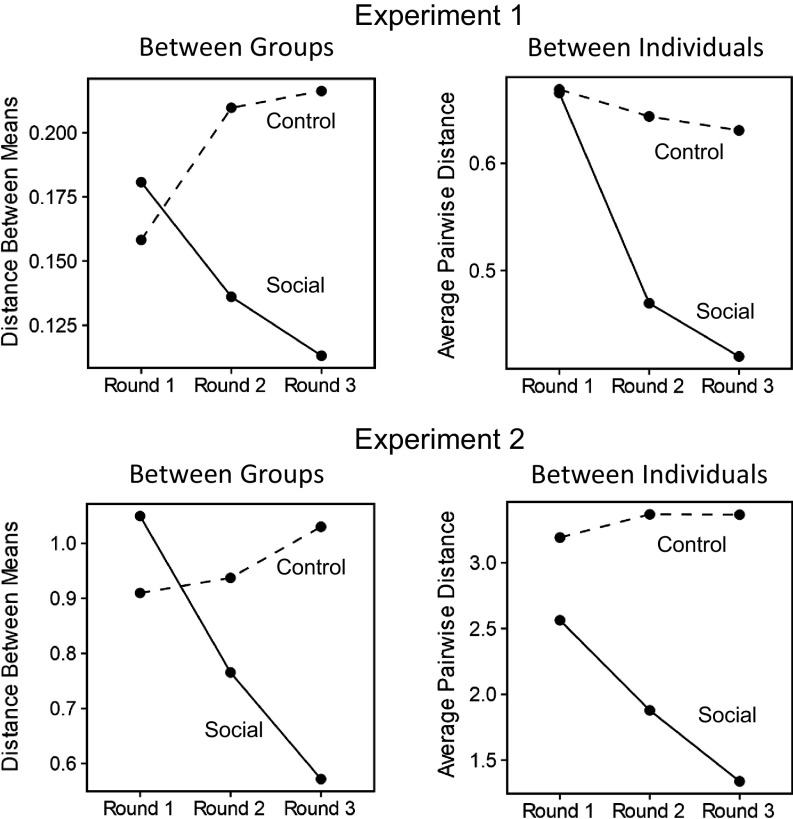
Fig. 3.
Points indicate polarization at each round of the experiment for both social networks (solid line) and control groups (dashed line). (Left) Difference in the normalized mean belief of Democrats and the normalized mean belief of Republicans. (Right) Average pairwise distance of normalized responses, which measures the expected difference between a randomly selected Democrat and Republican.

