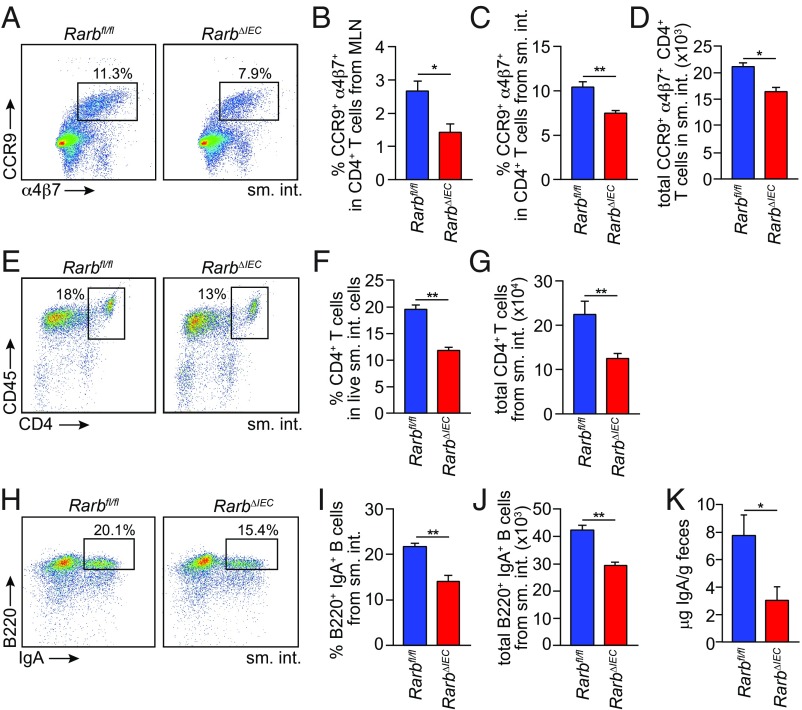
Fig. 5.
Epithelial RARβ regulates the development of gut homing T cells and IgA-producing B cells. (A–D) Expression of the gut homing markers α4β7 and CCR9 on T cells (CD4+ CD45+ CD3+) from Rarbfl/fl and RarbΔIEC littermates. (A) Representative flow cytometry plots of small intestinal T cells. Frequencies of CCR9+ α4β7+ cells in CD4+ CD45+ CD3+ cells from MLN (B) and small intestine (C). Total gut homing CD4+ T-cell numbers (CCR9+ α4β7+ CD4+ CD45+ CD3+) are given in D. n = 3 mice/group; data represent four independent experiments. (E) Flow cytometry of CD4+ (CD45+ CD3+) T cells from the small intestines of Rarbfl/fl and RarbΔIEC littermates. CD4+ (CD45+ CD3+) T-cell frequencies are quantified in F and total small intestinal CD4+ T-cell numbers (CD4+ CD45+ CD3+) are given in G. n = 3 mice per group; data represent four independent experiments. (H) Flow cytometry analysis of IgA+ B220+ (CD45+ CD19+) B cells from Rarbfl/fl and RarbΔIEC littermates. IgA+ B220+ cell frequencies in CD45+ CD19+ B cells are quantified in I, and total numbers of small intestinal IgA+ B cells are shown in J. n = 3 mice per group; data represent four independent experiments. (K) Quantification of fecal IgA by ELISA. n = 4 mice/group; data represent two independent experiments. Means ± SEM are plotted. *P < 0.05; **P < 0.01 as determined by Student’s t test. sm. int., small intestine. MLN, mesenteric lymph nodes.

