Fig. 2.
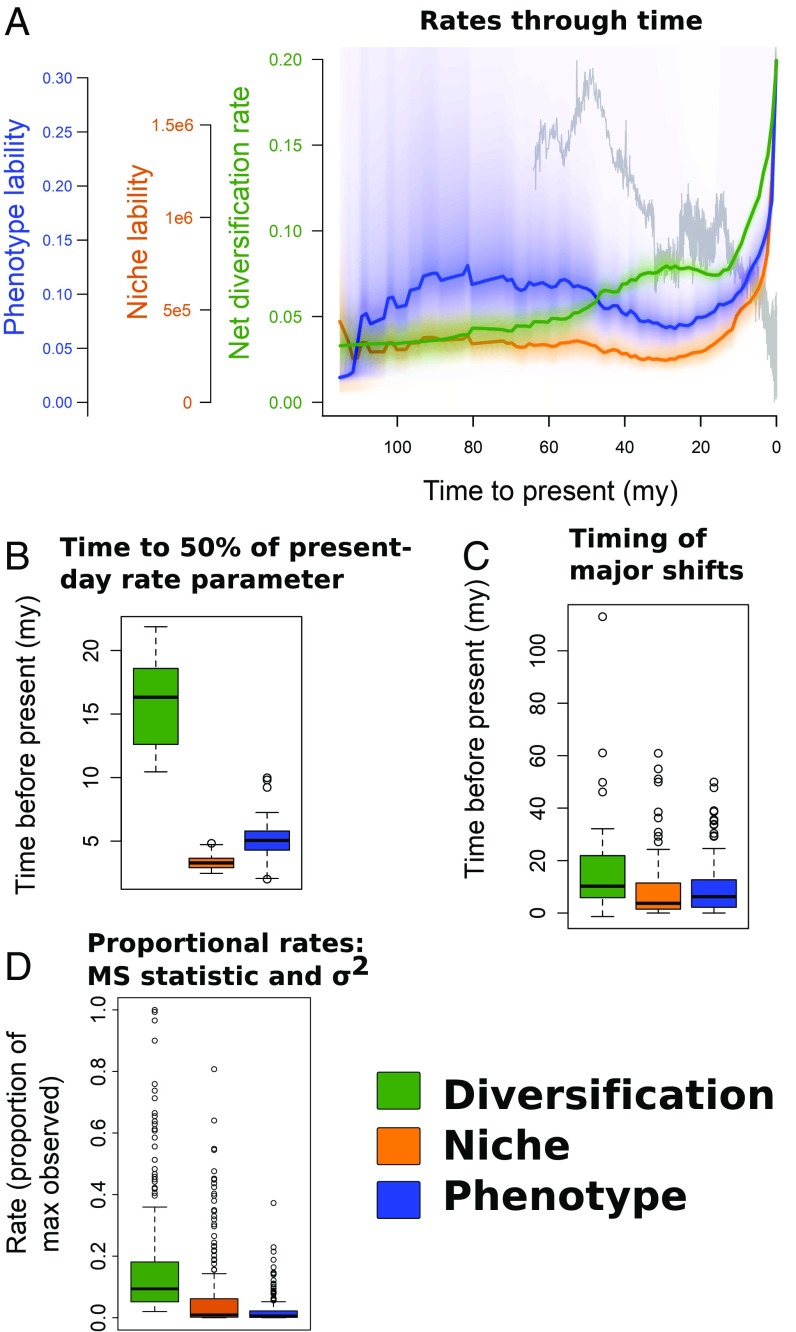
(A) Median rates and rate distributions for net diversification, niche, and phenotypic macroevolutionary rates (colors shown in legend). The unit of diversification is speciation events per million years; niche and phenotypic rates are unitless. For relative comparability, the y axis is scaled from zero to the maximum median rate for all datasets. The gray curve in the background is a global temperature dataset (37). High niche evolutionary rates result from large scaling of the PCA ordination of environmental data (SI Appendix, Fig. S41). (B) Box plot showing the distributions of times to 50% of contemporaneous evolutionary rates from the mid-Miocene (15 Mya to present). (C) Box plot showing the distributions of times to present for either major shifts in ancestral reconstructions (environment, phenotype; 95th percentile of node–parent node differences) or shifts in the best shift configuration (diversification). (D) Box plot of evolutionary rates for MS (diversification) and σ2 (niche and phenotype) as proportionally scaled to the maximum (contemporary) rates. Higher clade values for, for example, diversification indicate earlier rate increases. MS here parameterizes extinction as ε = 0.5; see SI Appendix, Figs. S8–S11 for evaluation of extinction fractions.

