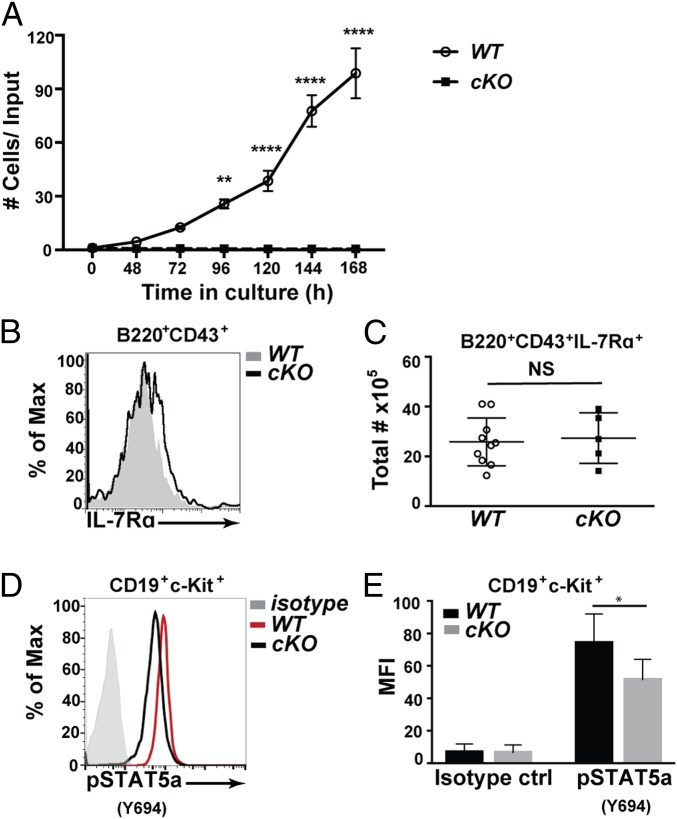
Fig. 3.
CHD4 is required for proliferation of pro-B cells downstream of IL-7R signaling. (A) Pro-B cells (B220+CD43+CD24+BP1+IgM–) were sorted from Chd4fl/flCd79a-CreTg/+ mice (cKO; n = 3) and WT littermate controls (n = 3) for culture in IL-7 (10 ng/mL). Cell counts were taken daily for 7 d, represented as the number of cells over the initial cell count. Asterisks indicate statistical significance compared with WT littermate controls using two-way ANOVA with Sidak’s multiple comparisons test. **P < 0.005, ****P < 0.0001. Graphs represent arithmetic mean with ±SEM. All data are representative of at least three independent experiments. (B) Representative flow cytometry of CD127 (IL-7Rα) expression on B220+CD43+ cells isolated from Chd4fl/flCd79a-CreTg/+ and WT littermate controls. (C) Total numbers of B220+CD43+CD127+ cells from the bone marrow of Chd4fl/flCd79a-CreTg/+ (n = 5) and WT (n = 10) mice. Each dot represents an individual mouse. (D) Representative flow cytometry of intracellular phosphor-STAT5a in c-Kit+ pro-B cells (Lin–CD19+c-Kit+CD25–IgM–IgD–) isolated from Chd4fl/flCd79a-CreTg/+ and WT littermate controls. (E) Detection of pSTAT5A in CD19+ c-Kit+ pro-B cells isolated from Chd4fl/flCd79a-CreTg/+ (n = 3) and WT (n = 3) mice. The lineage (Lin) stain included: CD3ε, CD11b, CD11c, Gr-1, NK1.1, Ly6C, CD317, and Ter119. Asterisks indicate statistical significance compared with WT littermate controls as unpaired, two-tailed Student’s t test without Welch’s correction. *P < 0.05, **P < 0.005, ****P < 0.0001, NS, not significant. Graphs represent arithmetic mean ± SD. All data are representative of at least three independent experiments.

