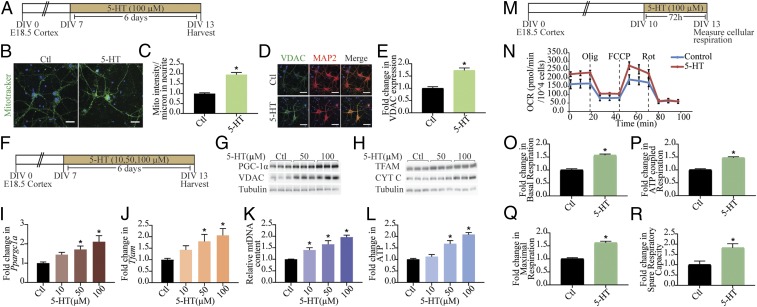
Fig. 1.
Mitochondrial biogenesis and function are regulated by 5-HT. (A) Shown is a schematic depicting the treatment paradigm with 5-HT (100 µM) in cultured cortical neurons, commencing at day in vitro (DIV) 7 until DIV 13. (B) Shown are representative confocal images for Mitotracker Green staining in control (Ctl) and 5-HT–treated (100 µM) neurons, with nuclei counterstained with Hoechst 33342 (blue). (Scale bars: 30 µm; magnification: 60×.) (C) Quantitative analysis of fluorescence intensity represented as mitotracker (mito) intensity per micrometer of neurite ± SEM (n = 56 neurons in control, n = 59 neurons for 5-HT treatment, mean values ± SEM compiled across N = 3). *P < 0.05 (compared with control, unpaired Student’s t test). (D) Shown are representative immunofluorescence images for VDAC (green), neuronal marker MAP2 protein (red), and merge (yellow) from control and 5-HT–treated (100 µM) neurons. Nuclei are counterstained with Hoechst 33342 (blue). (Scale bars: 50 µm; magnification: 60×.) (E) Quantitative analyses for VDAC fluorescence intensity are represented as fold change in VDAC expression compared with control ± SEM (n = 86 neurons in control, n = 78 neurons for 5-HT treatment, mean values ± SEM compiled across N = 3). *P < 0.05 (compared with control, unpaired Student’s t test). (F) Shown is a schematic depicting treatment of neurons with increasing doses of 5-HT (10, 50, and 100 µM). (G and H) Shown are representative immunoblots for PGC-1α, VDAC, and tubulin as the loading control (G) and TFAM, Cyt C, and tubulin as loading control (H) in neurons treated with increasing doses of 5-HT (50 and 100 µM). (I and J) Quantitative PCR (qPCR) analysis for mRNA expression of key regulators of mitochondrial biogenesis Ppargc1a (I) and Tfam (J) are represented as fold change of control ± SEM (representative results from n = 4 per treatment group/N = 3). *P < 0.05 (compared with control, one-way ANOVA, Tukey’s post hoc test). (K) qPCR analyses for mtDNA levels are represented as relative mtDNA content ± SEM (representative results from n = 4–6 per treatment group/N = 3). *P < 0.05 (compared with control, one-way ANOVA, Tukey’s post hoc test). (L) Quantitation of ATP levels expressed as fold change of control ± SEM (representative results from n = 4 per treatment group/N = 4). *P < 0.05 (compared with control, one-way ANOVA, Tukey’s post hoc test). (M) Shown is a schematic for the treatment paradigm with 5-HT (100 µM) (DIV 10–13) for Seahorse analysis of cellular respiration. (N) Shown is a representative Seahorse plot for control and 5-HT–treated cortical neurons, with measurements of OCR (normalized to cell numbers per well), baseline, and following treatment of cells with oligomycin (Olig), FCCP, and rotenone (Rot), as indicated. (O–R) Quantitative analysis of the effects of 5-HT on basal respiration (O), ATP-coupled respiration (P), maximal respiration (Q), and spare respiratory capacity (R) expressed as fold change of control ± SEM (compiled results from n = 5 per treatment group/N = 3). *P < 0.05 (compared with control, unpaired Student’s t test).

