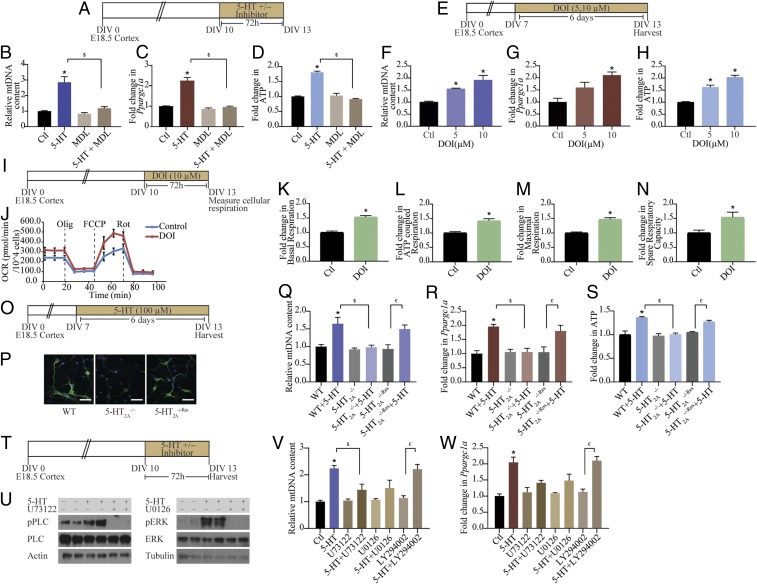
Fig. 2.
Mitochondrial effects of 5-HT are mediated via the 5-HT2A receptor. (A) Shown is a schematic depicting the treatment paradigm for cortical neuron cultures with 5-HT (100 µM), MDL100,907 (10 µM), and 5-HT+MDL100,907 for 72 h commencing on DIV 10. (B–D) Quantitation of mtDNA (B), Ppargc1a mRNA (C), and ATP (D) levels in cortical neurons treated with 5-HT in the presence or absence of MDL100,907 (MDL) are represented as fold change of control (Ctl) ± SEM [representative results from n = 4 per treatment group/N = 2 (mtDNA and ATP) and N = 3 (Ppargc1a mRNA)]. *P < 0.05 (compared with control); $P < 0.05 (compared with 5-HT–treated group); two-way ANOVA, Tukey’s post hoc test. (E) Shown is a schematic depicting the treatment paradigm for cortical neurons with increasing doses of DOI (5 and 10 µM) from DIV 7 to 13. (F–H) Quantitation of mtDNA (F), Ppargc1a mRNA (G), and ATP (H) levels in neurons treated with DOI are represented as fold change of control ± SEM (representative results from n = 4 per treatment group/N = 2). *P < 0.05 (compared with control, one-way ANOVA, Tukey’s post hoc test). (I) Shown is a schematic depicting the treatment paradigm of cortical neurons with DOI (10 µM) for Seahorse analysis of cellular respiration starting DIV 10. (J) Shown is a representative Seahorse plot for control and DOI-treated cortical neurons, with measurements of OCR (normalized to cell numbers per well) at baseline and following treatment with oligomycin (Olig), FCCP, and rotenone (Rot), as indicated. (K–N) Bar graphs depict quantitative analysis of the effects of DOI on basal respiration (K), ATP-coupled respiration (L), maximal respiration (M), and spare respiratory capacity (N) expressed as fold change of control ± SEM (compiled results from n = 4 or 5 per treatment group/N = 3). *P < 0.05 (compared with control, unpaired Student’s t test). (O) Shown is a schematic depicting the treatment paradigm of WT, 5-HT2A−/−, and 5-HT2A−/−Res cortical neurons with 5-HT (100 µM). (P) Shown are representative images for 5-HT2A receptor immunofluorescence (green) from WT, 5-HT2A−/−, and 5-HT2A−/−Res cortical neuron cultures with nuclei counterstained with Hoechst 33342 (blue). (Scale bars: 50 µm; magnification: 60×.) (Q–S) Graphs depict quantitative analysis for mtDNA (Q), Ppargc1a mRNA (R), and ATP (S) levels in WT, 5-HT2A−/−, and 5-HT2A−/−Res cortical neurons treated with 5-HT, and results are represented as fold change of WT ± SEM (representative results from n = 4 per treatment group/N = 2). *P < 0.05 (compared with WT); $P < 0.05 (compared with WT+5-HT); €P < 0.05 (compared with 5-HT2A−/−Res); two-way ANOVA, Tukey’s post hoc test. (T) Shown is a schematic depicting the treatment paradigm of cortical neurons with 5-HT (100 µM) in the presence or absence of signaling inhibitors for PLC (U73122; 5 µM), MEK (U0126; 10 µM), and PI3K (LY294002; 10 µM). (U) Shown are representative immunoblots for pPLC and PLC levels in cortical neurons treated with 5-HT in the presence or absence of the PLC inhibitor U73122 and for pERK and ERK levels in cortical neurons treated with 5-HT in the presence or absence of the MEK inhibitor U0126. Actin and tubulin immunoblots serve as the loading controls. (V and W) Quantitative analysis for mtDNA (V) and Ppargc1a mRNA (W) levels in cortical neurons treated with 5-HT in the presence or absence of PLC, MEK, and PI3K inhibitors are represented as fold change of control ± SEM (representative results from n = 4 per treatment group/N = 2). *P < 0.05 (compared with control); $P < 0.05 (compared with 5-HT–treated group); €P < 0.05 (compared with LY294002 group); two-way ANOVA, Tukey’s post hoc test.

