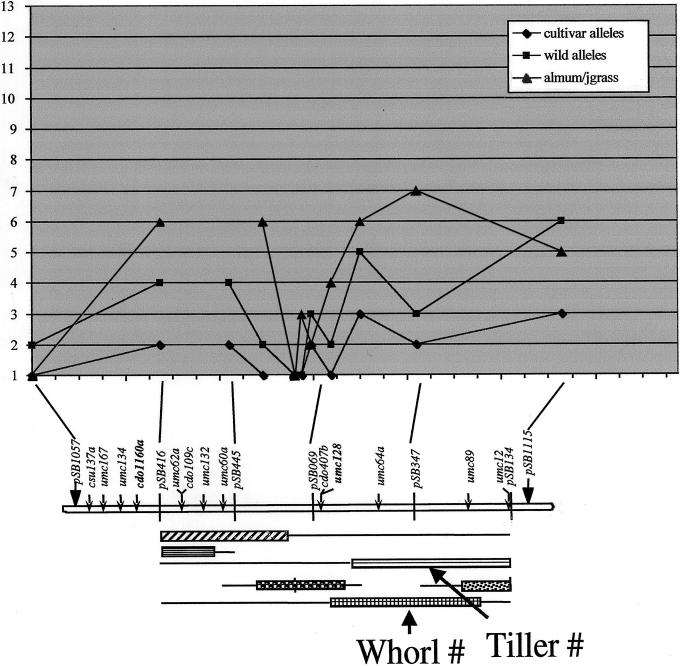
Figure 6.
Diversity map for LG G. The nature of each gene pool is described in the text. The total number of alleles in each gene pool, at each locus, has been plotted at the chromosomal location of each locus, and data for different gene pools has been coded (see inset). QTL data plotted along the map is from a population of 370 individuals from the same F1 plant that was used to make the primary linkage map, as previously described (Lin et al., 1995; Paterson et al., 1995a, 1995b).

