Fig. 3.
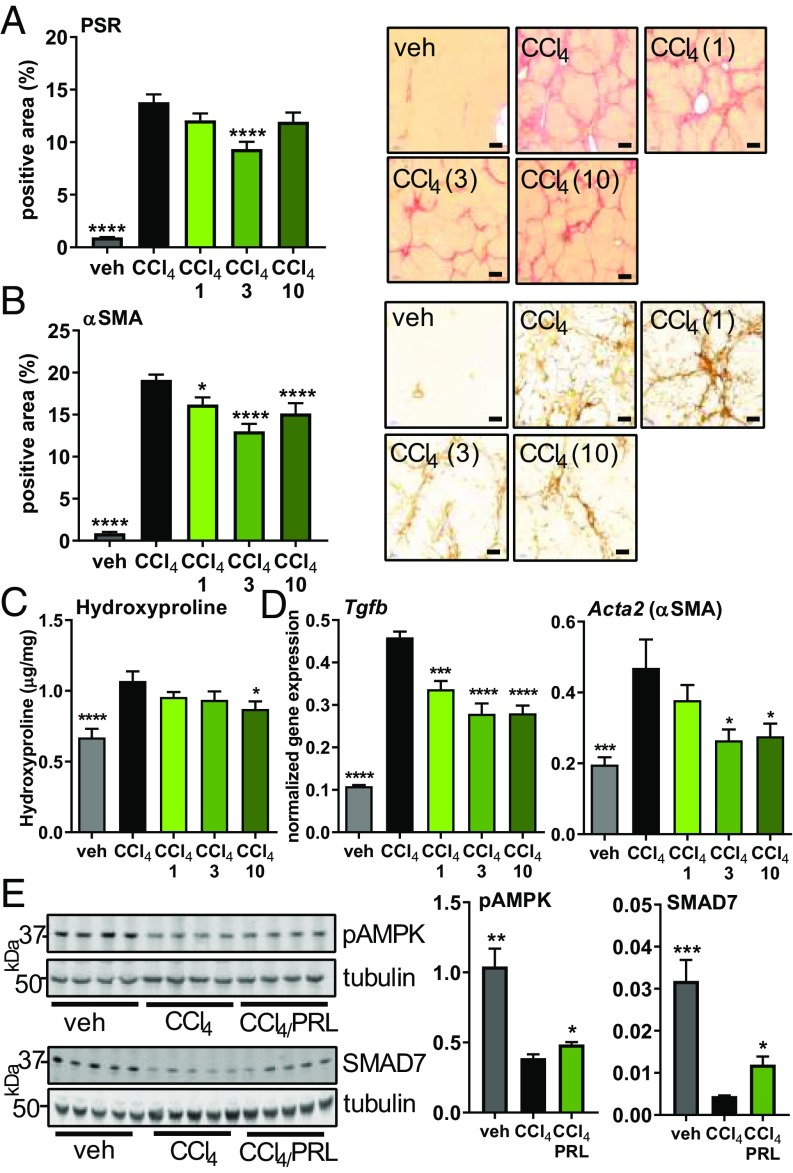
Antifibrotic effect of praliciguat in the CCl4 model. Experimental groups are vehicle (corn oil) (n = 12), CCl4 alone (n = 12), or CCl4 with 1 (n = 12), 3 (n = 12), or 10 mg/kg (n = 12) of praliciguat per day. (A, Left) PSR-positive tissue area. Data analyzed by one-way ANOVA followed by Fisher’s least significant difference comparison with the CCl4 group. (A, Right) Representative images of a tissue section from each group. (Scale bar: 200 μm.) (B, Left) Quantification of α-SMA–positive tissue area for each experimental group. (B, Right) Representative images of a tissue section from each group. (Scale bar: 100 μm.) (C) Hepatic hydroxyproline content in each experimental group. (D) mRNA expression levels of fibrotic markers in liver tissue: Tgfb and Acta2. Data analyzed using one-way ANOVA followed by Dunnett’s multiple comparison with the CCl4 group alone. (E) Liver lysate from vehicle, the CCl4 control group, and the 3 mg/kg per day praliciguat (PRL) group were probed for pAMPK (Ser-108), SMAD7, and tubulin. Unpaired t tests comparing each condition to the CCl4-alone group. *P ≤ 0.05, **P ≤ 0.01, ***P ≤ 0.001, ****P ≤ 0.0001.

