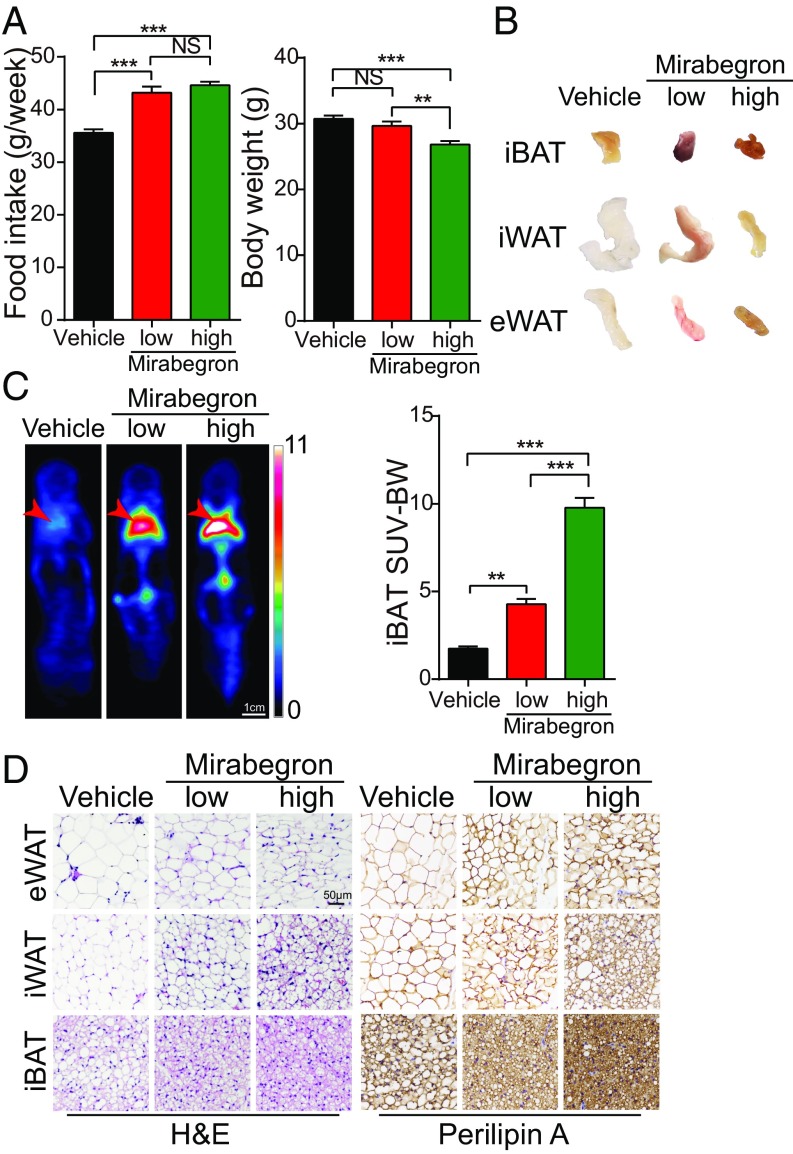
Fig. 1.
The effect of mirabegron on food intake, body weight, adipose deposition, and browning of WAT and BAT. (A) The effect of 6 wk of treatment with mirabegron at low and high doses on food intake (n = 5 animals per group) and body weight (n = 15 animals per group). NS, not significant; **P < 0.01; ***P < 0.001. (B) Adipose tissue morphology of 6-wk mirabegron-treated iBAT, iWAT, and eWAT. (C) Representative position emission tomography-computed tomography images of mirabegron-treated mice at day 4. Red arrows indicate the position of iBAT. (D) H&E and perilipin A staining of 6-wk mirabegron-treated eWAT, iWAT, and iBAT. (Scale bar, 50 μm.)

