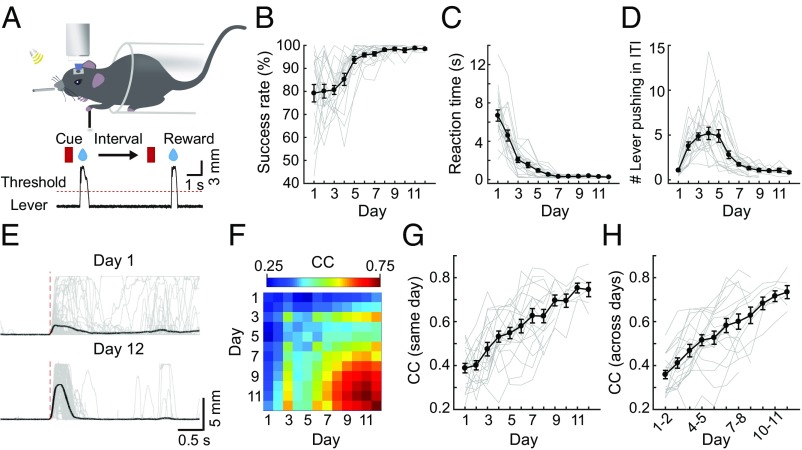
Fig. 1.
Mouse learning of a cued lever-pushing task. (A) Schematic diagram of the motor task. A head-fixed mouse was trained to push a lever in response to a sound cue within a fixed time window. Successful lever pushing was rewarded with a drop of water. (B) Success rate (percentage of rewarded trials) in cued lever pushing steadily increased to a plateau over days of training (r = 0.62, P < 0.001). (C) Reaction time (duration from the cue onset to the rewarded movement onset) decreased with days of training (r = −0.69, P < 0.001). (D) Average number of lever-pushing events in each trial during the ITI with days of training. The frequency of uncued pushing during ITIs showed an initial increase (days 1–4; r = 0.59, P < 0.001), followed by a decrease (days 5–12; r = −0.53, P < 0.001). (E) Example traces of the lever-pushing movement in one mouse on days 1 and 12 of training. (F) Pairwise correlation matrix of lever-pushing trajectories for all trial pairs within the same day and between two different days (data from one example mouse). The pairwise correlation of lever-pushing trajectories for all trial pairs within each day (G; r = 0.69, P < 0.001) and between adjacent days (H; r = 0.68, P < 0.001) is shown. In B–D, G, and H, gray lines depict the average of data of all trials from individual mice and the black line represents the average of data of all mice (B–D; n = 19 mice for days 1–7; n = 17, n = 11, n = 7, n = 7, and n = 6 mice for days 8–12, respectively; data from the same group of mice were used in G and H). Error bars represent SEM.

