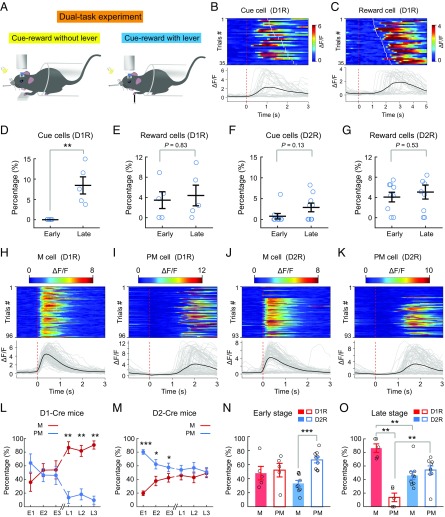
Fig. 5.
Relationship between D1R and D2R neuronal activity and various behavioral events. (A) Schematic diagram of the dual-task experiment. In the cue-reward without lever-pushing task, the lever was replaced with a platform for the mouse forelimb to rest on and the mouse received a water reward after a random delay period (within 1–2.5 s) following the auditory cue. On each day, the mouse first performed the cue-reward without lever-pushing task (for 30–40 trials) and then performed the standard cued lever-pushing task. The same populations of neurons were recorded during both tasks. (B) Example D1R neuron that responded to the cue, identified in the cue-reward without lever-pushing task. (Top) Heatmap of fluorescence transients of individual trials, aligned to cue onset. The red dashed line indicates cue onset, and white lines indicate reward delivery time. (Bottom) ΔF/F for individual trials (gray lines) and the average (black line) of all trials for the example neuron above in one session. (C) Example D1R neuron that responded to reward delivery. The red dashed line indicates cue onset, and white lines indicate reward delivery time. The heatmap and ΔF/F traces were plotted in the same manner as in B. (D and F) Percentages of cue cells among all responsive neurons observed in cued lever-pushing task during the early and late stages for D1-Cre and D2-Cre mice (D1, n = 5; D2, n = 9; **P < 0.01 by Wilcoxon rank sum test). (E and G) Percentages of reward cells among all responsive neurons observed in the cued lever-pushing task during the early and late stages (D1, n = 5 mice; D2, n = 9 mice; Wilcoxon rank sum test). Example D1R (H and I) and D2R (J and K) neurons that responded during the lever-pushing movement (M cell) and after lever pushing (PM cell) are shown. The red dashed line indicates movement onset. The heatmap and ΔF/F traces were plotted in the same manner as in B. Percentages of neurons responding during the lever-pushing period (M cell) and postmovement period (PM cell) on E1–E3 and L1–L3 for D1-Cre mice (L) and D2-Cre mice (M) are shown. Significant differences were found between M and PM cells at the late stage for D1-Cre mice and at the early stage for D2-Cre mice (D1, n = 5 mice; D2, n = 9 mice; *P < 0.05, **P < 0.01, ***P < 0.001 by Wilcoxon rank sum test). Averages of the percentages of M and PM cells for all 3 d at the early stage (N, E1–E3) and late stage (O, L1–L3) are shown. The Wilcoxon rank sum test was used as the statistical test. Error bars represent SEM.

