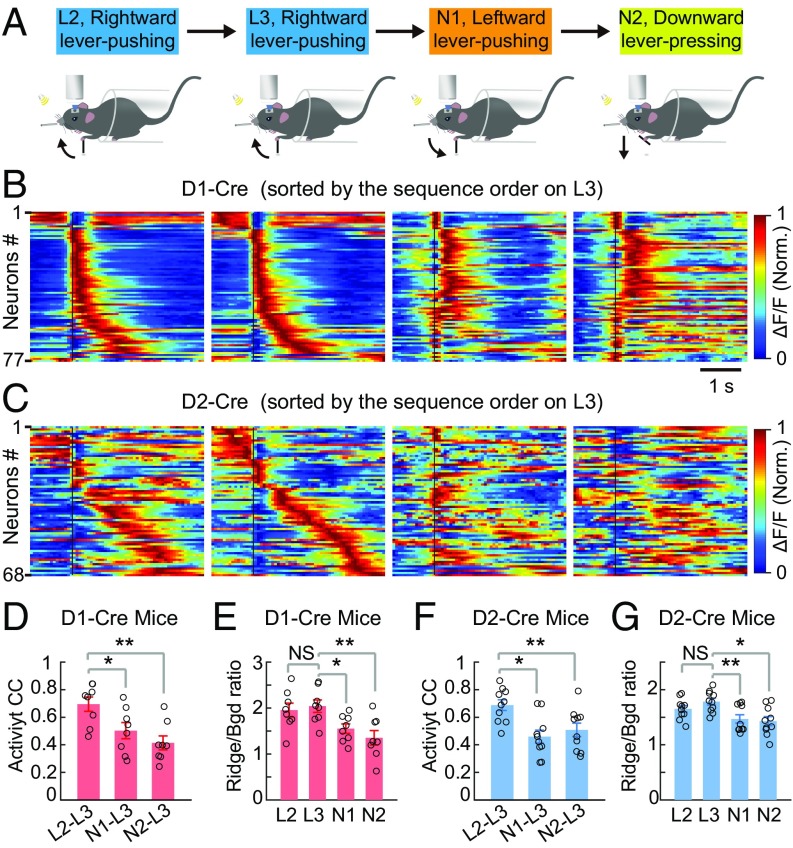
Fig. 6.
Reproducible sequential firing was motor task-specific. (A) Schematic diagram for the change in motor tasks. L2 and L3, the last 2 d of learning the rightward lever-pushing task; N1 and N2, 2 d of performing the leftward lever-pushing (N1) and downward lever-pressing (N2) tasks following L3. (B and C) Averaged activity of the same populations of D1R and D2R neurons on L2, L3, N1, and N2 recorded in one example mouse each, with cells sorted according to the sequence firing order determined on L3. Black lines indicate the onset time of lever movement. Norm., normalized. CCs of average activity between L3 and all three other days, calculated using the temporal population activity vector similar to that in Fig. 3, are shown (D, D1-Cre, n = 8 mice; F, D2-Cre, n = 10 mice; **P < 0.01, *P < 0.05 by Wilcoxon rank sum test). Ridge/Bgd ΔF/F ratios on L2, L3, N1, and N2 for the same dataset are shown (E, D1-Cre, n = 8 mice, P = 0.65; G, D2-Cre, n = 10 mice, P = 0.16; **P < 0.01, *P < 0.05, Wilcoxon rank sum test). NS, not significant. Error bars represent SEM.

