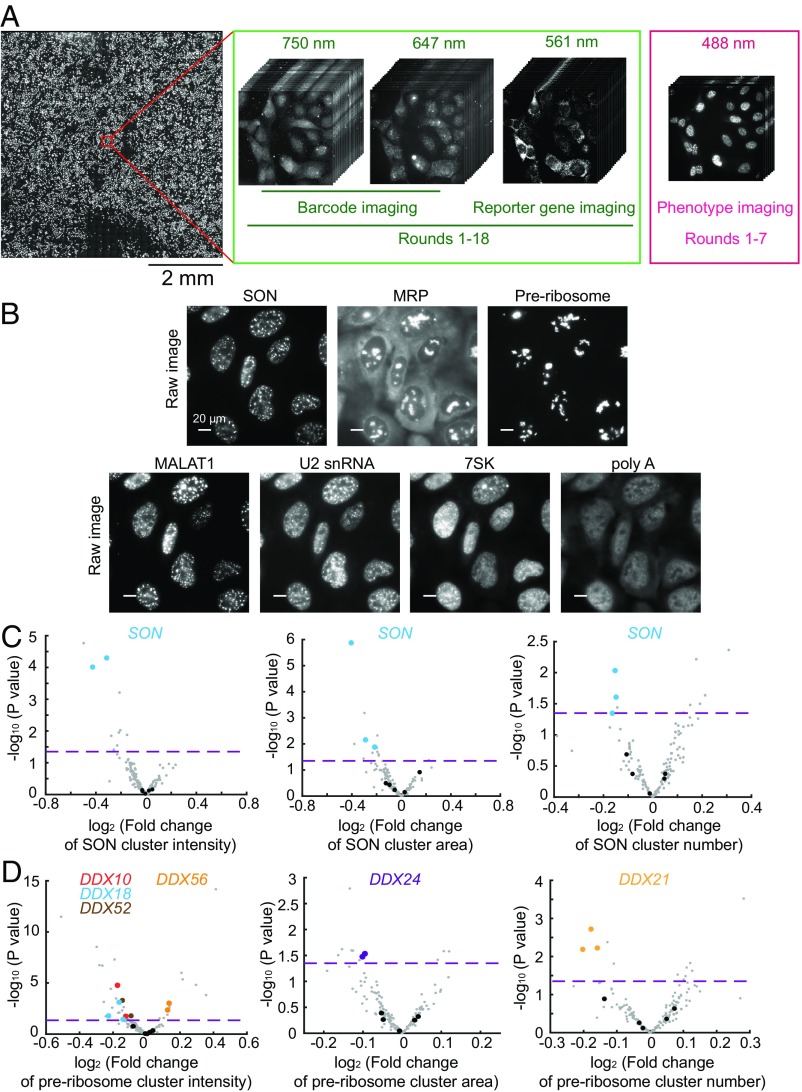
Fig. 4.
Imaging-based pooled CRISPR screening for regulators of nuclear RNA localization. (A) The scheme of imaging-based screening. Cells infected with lentiviruses expressing sgRNAs, barcodes, and the reporter gene are fixed and imaged. The barcodes are imaged by MERFISH using 647-nm and 750-nm color channels in 18 rounds of hybridization (rounds 1–18). To increase the accuracy of barcode imaging, the reporter gene mRNA is imaged in every round (rounds 1–18) using the 561-nm color channel to allow the determination of colocalization between barcode and reporter gene mRNA signals. The seven protein and RNA targets for phenotype measurements are imaged in the 488-nm color channel in the first seven rounds (rounds 1–7). The mosaic on the left contains 900 fields of view from a single screen. (B) Phenotype images of SON, MRP, preribosome, MALAT1, U2 snRNA, 7SK, and poly-A–containing RNAs. SON marks nuclear speckles, and preribosome and MRP mark subnucleolar structures. For SON, preribosome, and MRP, the cluster numbers, cluster areas, and cluster intensities are quantified. For MALAT1, U2 snRNA, 7SK, and poly-A–containing RNAs, their enrichments in nuclear speckles are quantified. (Scale bars: 20 µm.) (C) Volcano plots for the effect of each sgRNA on SON cluster intensity, cluster area, and cluster number. (D) Volcano plots for the effect of each sgRNA on preribosome cluster intensity, cluster area, and cluster number. In C and D, the fold change induced by each sgRNA is calculated as the mean value from all cells containing this sgRNA divided by the mean value from all cells containing nontargeting sgRNAs. The horizontal dashed lines indicate the P value (0.05) used to define a hit of the screen. The data points of the indicated hits (i.e., two of the three sgRNAs targeting the gene show statistically significant fold changes; P < 0.05) are shown in colors matching the colors of the gene names shown in the legend, data points for other gene-targeting sgRNAs are shown in gray, and data points for nontargeting sgRNAs are shown in black. Additional hits are shown in Dataset S3.

