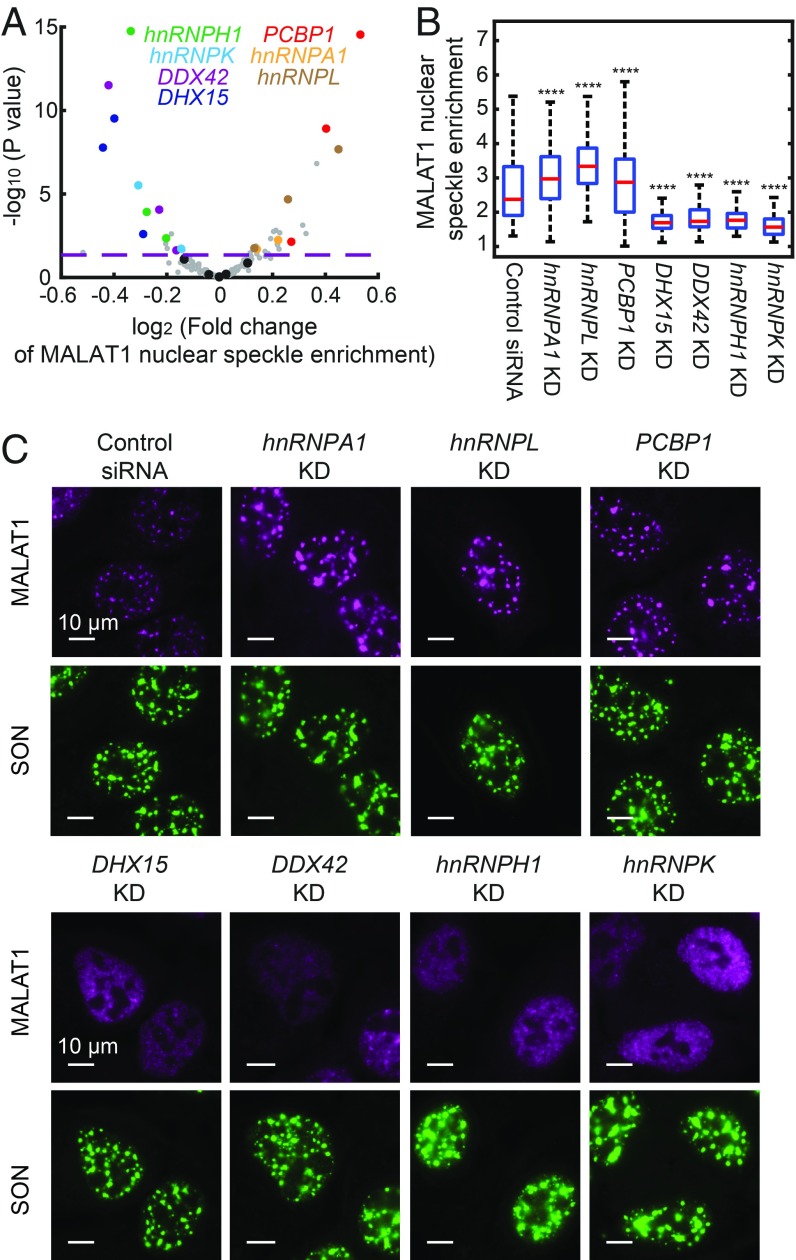
Fig. 5.
Genetic factors involved in the regulation of MALAT1 nuclear speckle localization. (A) Volcano plot for the effect of each sgRNA on MALAT1 nuclear speckle enrichment. The fold change is calculated as described in Fig. 4. The horizontal dashed line indicates the P value (0.05) used to define hit of the screen. The hits confirmed by siRNA knockdown are highlighted in colors matching the colors of the gene names shown in the legend, data points for other gene-targeting sgRNAs are shown in gray, and data points for nontargeting sgRNAs are shown in black. (B) Boxplots showing the effect of siRNA knockdown of the seven hit genes on MALAT1 localization alongside data for a control, nontargeting siRNA. The red lines show the median, the boxes show the 25th to 75th quartiles, and the whiskers show the maximum and minimum values. Between 100 and 300 cells are quantified for each condition. Student’s t tests are performed for each condition in comparison with control. ****P < 0.0001. (C) Images of MALAT1 localization on siRNA knockdown of the seven hit genes. Data from a control nontargeting siRNA are also shown. MALAT1 staining is shown in magenta, and SON staining is shown in green. (Scale bars: 10 µm.)

