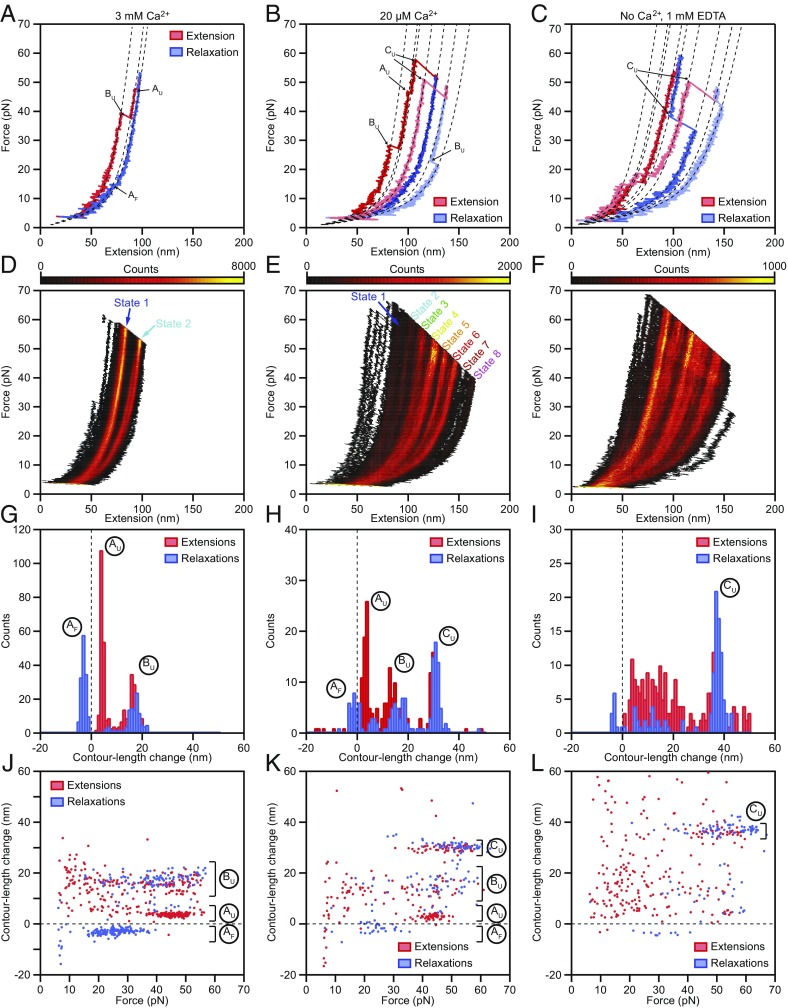
Fig. 2.
Force-extension measurements of PCDH15 monomers. (A) At a Ca2+ concentration of 3 mM, individual force-extension cycles show two distinct classes of abrupt elongations, the unfolding events AU and BU, as well as refolding events of class AF. The dashed lines represent fits to the trajectories by a protein model. (B) Reducing the Ca2+ concentration to 20 μM elicits an additional class of unfolding events, CU, corresponding to the unfolding of entire cadherin domains. (C) In the absence of Ca2+, unclassifiable structural changes occur in conjunction with the well-defined events CU. (D–F) Heatmaps displaying all the force-extension cycles for a single representative molecule at each Ca2+ concentration. The data were binned into pixels of 1 nm × 0.1 pN. A much smaller portion of the state space is accessible at a Ca2+ concentration of 3 mM than at a Ca2+ concentration of 20 µM or in the absence of Ca2+. The heatmaps illustrate which contour lengths of the tethered molecules occurred with increased likelihood during our force-loading protocol as an average over both extensions and relaxations. Prominent regions of elevated occupancy are labeled states 1–8, in which state 1 corresponds to the fully folded protein and state 8 results from the unfolding of three cadherin domains in series with one event of type Bu. (G–I) Histograms of the contour length changes of all abrupt elongations verify that these rips can be grouped into classes AF, AU, BU, and CU at Ca2+ concentrations of 3 mM and 20 µM. In the absence of Ca2+, most of the contour length changes are more broadly distributed. (J–L) Plots of the contour length change of every rip against the force at which that event occurred revealing the force distributions of each class of structural change. Note that the extensions never completely unfolded a PCDH15 molecule, so elongations could occur even during the relaxation phases. Because the contour lengths observed for the folded protein correspond to the length of monomeric PCDH15 in series with its molecular anchors, the measured extensions exceed those expected for the protein alone. Our analysis corrects for this influence, resulting in values in excellent agreement with the known structure of the protein (Table 1). All force-extension cycles were sampled at intervals of 10 μs and smoothed to a temporal resolution of 1 ms. The waiting times between cycles were 0.2 s for a Ca2+ concentration of 3 mM, 2 s for a Ca2+ concentration of 20 µM, and 4 s in the absence of Ca2+. The number of cycles recorded was 500 for a Ca2+ concentration of 3 mM and 200 for a Ca2+ concentration of 20 µM and in the absence of Ca2+.

