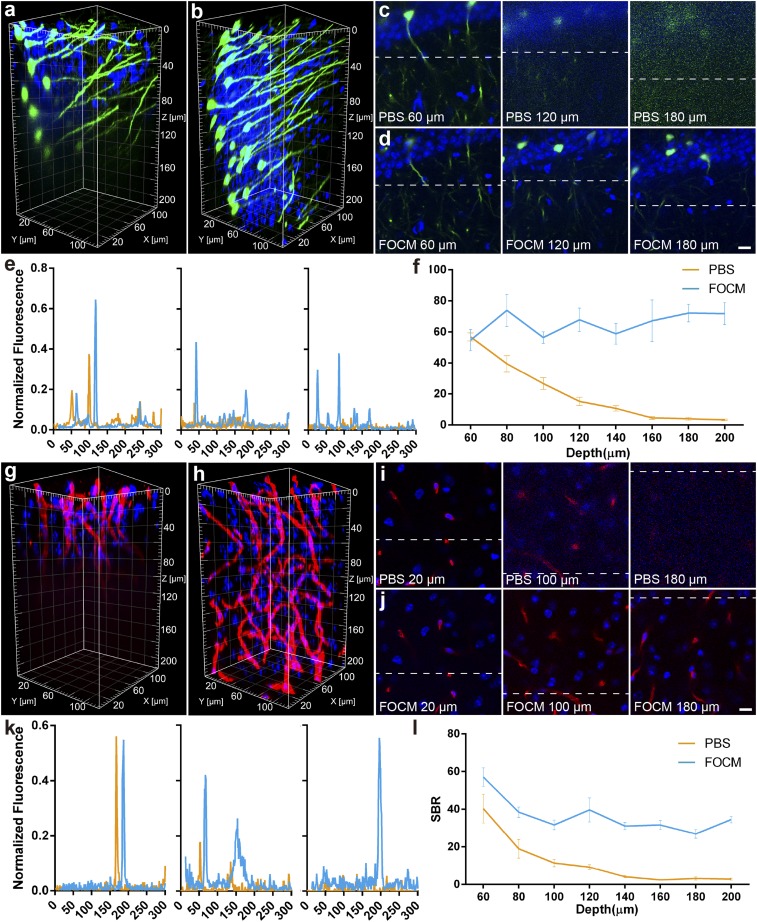
Fig. 4.
Fluorescence imaging quality improvement with the FOCM. (A and B) Three-dimensional reconstruction of Thy1-GFP-M mouse with DAPI staining before (A) and after (B) FOCM clearing. (C and D) Selected single imaging at the depth of 60 µm, 120 µm, and 180 µm before (C) and after (D) FOCM clearing. (E) Normalized fluorescence corresponding to the same dendrites indicated by the dash line in C and D. (F) SBR analysis from the depth of 60 µm to 200 µm. (G and H) Three-dimensional reconstruction of collagen with DAPI staining before (G) and after (H) FOCM clearing. (I and J) Selected single imaging at the depth of 20 µm, 100 µm, and 180 µm before (I) and after (J) FOCM clearing. (K) Normalized fluorescence corresponding to the same blood vessel indicated by the dash line in I and J. (L) SBR analysis from the depth of 60 µm to 200 µm. (Scale bars: 10 µm.)

