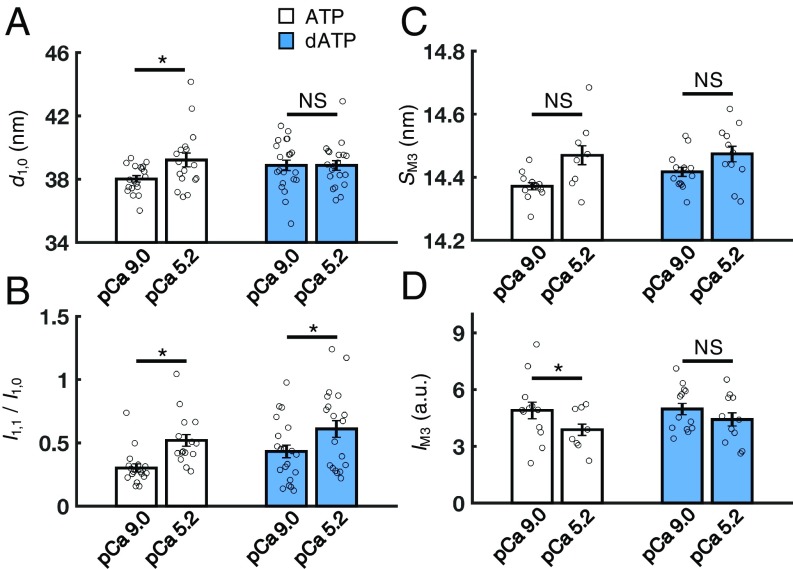
Fig. 5.
Effects of dATP on lattice geometry and myosin filament structure in activated muscle (SL = 2.3 μm, μ = 170 mM). Upon activation (pCa 5.2), cardiac muscle with ATP (white bars) has an increased lattice spacing (A, d1,0), an increased I1,0/I1,1 ratio (B), no change in the spacing of the M3 reflection (C, SM3), and a significantly reduced intensity of the M3 reflection (D, IM3) compared with resting muscle (pCa 9.0). However, in preparations containing dATP (blue bars), I1,0/I1,1 is significantly increased upon activation, while all other parameters are not significantly different between relaxed (pCa 9.0) and activated (pCa 5.2) states. Error bars represent SEM for n ≥ 8 preparations. *P < 0.05 using a paired Student t test. a.u., arbitrary units; NS, not significant. (Numerical values are reported in SI Appendix, Table S2.)

