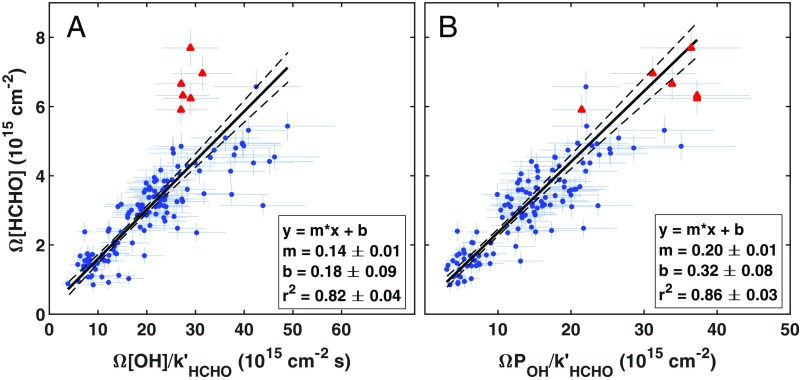
Fig. 2.
Total-column HCHO loss tracks oxidizing capacity in the remote troposphere. ATom observations (n = 139) of Ω[HCHO] against HCHO loss frequency-normalized Ω[OH] (A) and ΩPOH (B) obey the theoretical relationship described by Eq. 3. Error bars reflect the combined 1σ uncertainty of observations and rate coefficients. Red triangles denote fire-impacted columns sampled near Equatorial Africa during ATom 2. Solid black lines represent uncertainty-weighted “least-squares cubic” regressions that minimize error-weighted residuals along both axes (56). Dashed lines are 1σ fit CIs. Fit coefficients are given with their 1σ uncertainty. Fire-impacted points are excluded from the fit in A.

