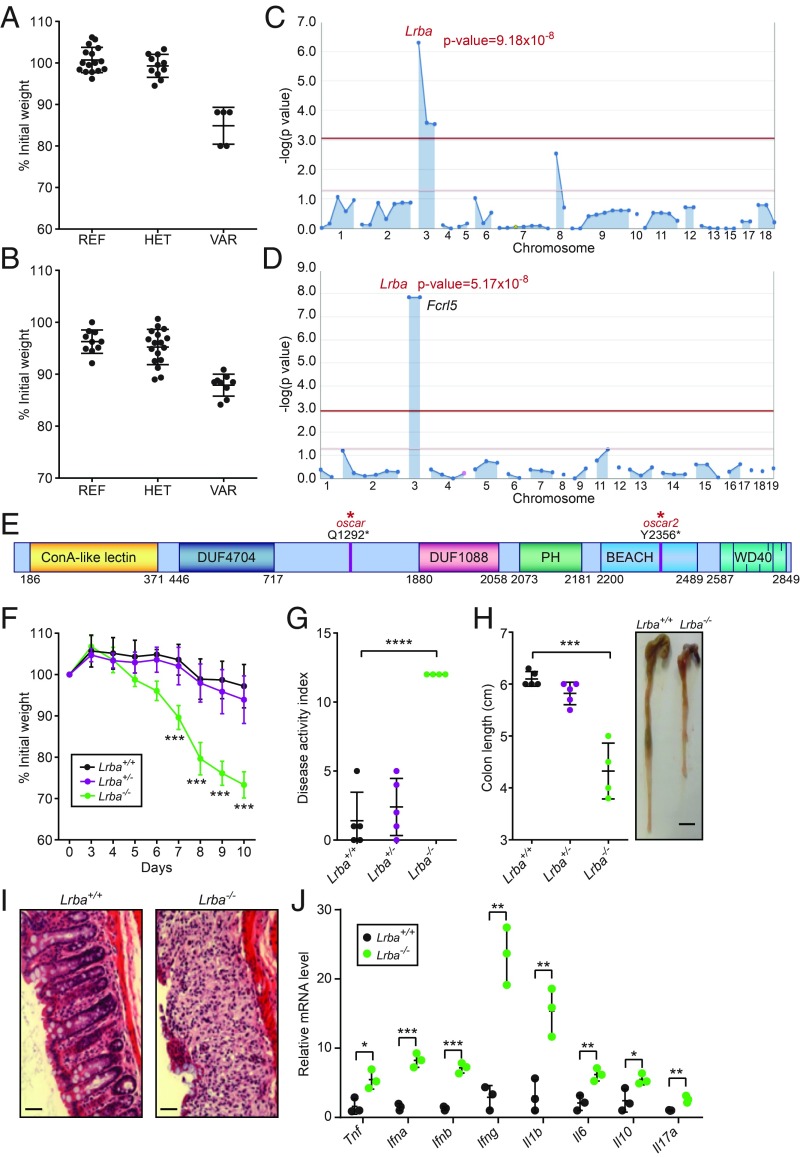
Fig. 1.
Mapping of the oscar and oscar2 mutations in Lrba. (A) Body weight (% relative to weight on day 0) of the oscar pedigree on day 10 after initiation of DSS treatment. REF, Lrba+/+ (n = 16); HET, Lrbaoscar/+ (n = 11); VAR, Lrbaoscar/oscar (n = 5). (B) Body weight (% relative to weight on day 0) of the oscar2 pedigree on day 7 after initiation of DSS treatment. REF, Lrba+/+ (n = 10); HET, Lrbaoscar2/+ (n = 17); VAR, Lrbaoscar2/oscar2 (n = 9). (C and D) Manhattan plots showing P values of association between the DSS-induced weight loss phenotype and the mutations identified in the oscar (C) and oscar2 (D) pedigrees calculated using a recessive model of inheritance. The −log10 P values are plotted versus the chromosomal positions of mutations. Horizontal red and purple lines represent thresholds of P = 0.05 with or without Bonferroni correction, respectively. The P values for linkage of Lrba mutations are indicated. (E) Protein domain diagram of LRBA with the oscar and oscar2 mutations indicated. DUF, domain of unknown function; WD40, WD40 repeat domain. (F) Body weight (% relative to weight on day 0) of Lrba+/+ (n = 5), Lrba+/− (n = 5), and Lrba−/− (n = 4) mice on the indicated day after initiation of DSS treatment. (G) DAI and (H) colon length of Lrba+/+ (n = 5), Lrba+/− (n = 5), and Lrba−/− (n = 4) mice on day 10 after initiation of DSS treatment. The side panel in H shows a representative image of colons. (Scale bar, 5 mm.) (I) Colon sections stained with hematoxylin and eosin on day 10 after initiation of DSS treatment. (Scale bars, 80 μm.) (J) RT-qPCR analysis of the indicated mRNAs in colons from Lrba+/+ (n = 3) and Lrba−/− (n = 3) mice on day 6 after initiation of DSS treatment. Each symbol (A, B, G, H, and J) represents an individual mouse. *P < 0.05; **P < 0.01; ***P < 0.001; ****P < 0.0001 for comparison of the indicated genotype with Lrba+/+ (two-tailed Student’s t test). Data are representative of three independent experiments (mean ± SD in A, B, F, G, H, and J).

