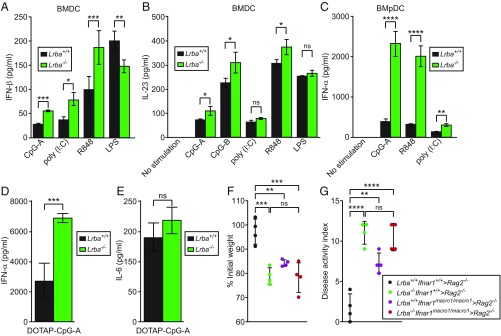
Fig. 3.
Increased type I IFN responses to endosomal TLR stimulation in Lrba−/− DCs. (A–E) In vitro differentiated BMDCs or BMpDCs were stimulated with TLR ligands for 16 h. Concentration of (A) IFN-β or (B) IL-23 in the culture supernatant of BMDCs after stimulation with different TLR ligands (n = 4 independent cultures of each genotype from separate mice). (C) Concentration of IFN-α in the culture supernatant of BMpDCs after stimulation with the indicated ligands (n = 3 independent cultures of each genotype from separate mice). (D and E) Serum concentration of (D) IFN-α and (E) IL-6 4 h after injection of DOTAP-encapsulated CpG-A into mice (n = 4 mice per genotype). (F and G) BM transplantation was performed using mice of the indicated genotypes (donor > recipient). (F) Body weight (% relative to weight on day 0) and (G) DAI on day 10 after initiation of DSS treatment. Lrba+/+Ifnar1+/+ > Rag2−/− (n = 4), Lrba−/−Ifnar1+/+ > Rag2−/− (n = 4), Lrba+/+Ifnar1macro−1/macro−1 > Rag2−/− (n = 4), and Lrba−/−Ifnar1macro−1/macro−1 > Rag2−/− (n = 4). *P < 0.05; **P < 0.01; ***P < 0.001; ****P < 0.0001 (two-tailed Student’s t test for A–E; one-way ANOVA with post hoc Tukey multiple comparisons test for F and G). Data are representative of three (B, F, and G) or four (A and C–E) independent experiments (mean ± SD).

