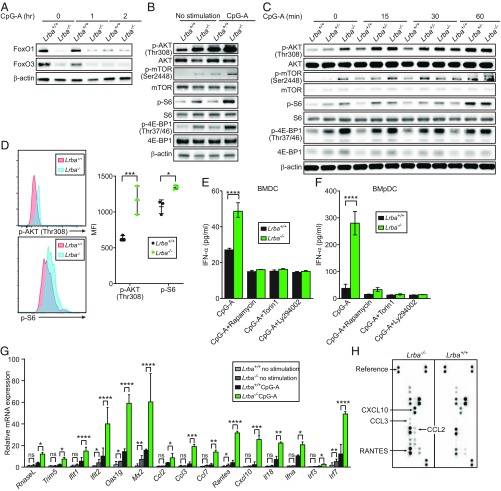
Fig. 5.
Enhanced PI3K/AKT/mTOR signaling in Lrba−/− BMDCs and BMpDCs. (A) Immunoblot analysis of FOXO1 and FOXO3 in Lrba+/+ and Lrba−/− BMpDCs after stimulation with CpG-A. (B and C) Immunoblot analysis of phosphorylated and total mTOR, AKT, S6, and 4E-BP1 in Lrba+/+, Lrba+/−, and Lrba−/− (B) BMpDCs and (C) BMDCs stimulated with CpG-A for 16 h (B) or for the indicated times (C). (D, Left) Flow cytometry of Lrba+/+ and Lrba−/− splenocytes, assessing expression of p-AKT and p-S6 by CD11c+ DCs. (D, Right) Quantification of p-AKT and p-S6 mean fluorescence intensity (MFI) on CD11c+ DCs. (E and F) Concentration of IFN-α in the culture supernatant of (E) BMDCs or (F) BMpDCs pretreated with PI3K and mTOR inhibitors for 3 h, then stimulated with CpG-A for 16 h (n = 3 independent cultures of each genotype from separate mice). (G) RT-qPCR analysis of the indicated mRNAs in Lrba+/+ and Lrba−/− BMpDCs after stimulation with CpG-A for 16 h. (H) Protein array analysis of the culture supernatant from BMpDCs stimulated with CpG-A. Each symbol (D) represents an individual mouse. *P < 0.05; **P < 0.01; ***P < 0.001; ****P < 0.0001 (two-tailed Student’s t test). Data are representative of two or three independent experiments (mean ± SD in D–G).

